
|

|
Funded in part by NASA's Space Archaeology program |
|
Development and Site Destruction
The NASA ROSES Project Work Plan
Phase I: Identification of Sites from Satellite Imagery
Summary of CORONA image analysis with ImageJ
Phase II – Condition Assessment
Classification and Quantification Procedures
Major Sources of Adverse Impact on Archaeological Sites in Lebanon
The Impact of Agriculture on Cultural Heritage and Archaeological Sites
Observed Impacts —Agricultural Land Use on Archaeological Sites in Lebanon
Developmental Impacts on Archaeological Sites
Observed Impacts — Fertilizer Mining
The Impact of Archaeological Excavation and Looting on Sites
Observed Impacts – Archaeological Excavation and Looting
Exacerbating Factors that Encourage Looting in Lebanon
The Impact of Warfare on Cultural Heritage and Archaeological Sites
Warfare in Lebanon and its Impact on Archaeological Sites
Observed Impacts – Warfare and Military Activity
Observed Impacts – Housing/Infrastructure Development
Land Use Change over Forty Years – Major Trends
Relationships between Land Classes
Summary: Impacts of this Project on the Archaeology of the Levant
Sites and Satellite Images Note: This is the equivalent of Appendices A and B. For the sake of this presentation, each site's data and its four satellite images are displayed together.
In this document we present the final report of our NASA ROSES 2009 research project, “Climate Change and Human Impact on Ancient and Modern Settlements: Identification and Condition Assessment of Archaeological Sites in the Northern Levant from Landsat, ASTER and CORONA imagery.” The report covers two major phases of effort: 1) georeferencing CORONA imagery for the northern Levant, and determining site locations and boundaries; 2) land classification and digitizing of sites and buffers in 1970 CORONA imagery and 2010 Google Earth imagery, with comparison to Landsat and ASTER imagery from the 1997-2001 period, statistical analysis of land classifications, and uploading results into the Digital Archaeological Atlas of the Holy Land (http://gaialab.asu.edu/DAAHL). This report details a thorough examination of 82 archaeological tell sites in Lebanon, chosen from an initial inventory of more than 1300 sites (Lehmann 2002) because of their documented Early and Middle Bronze Age (ca. 3600 BCE to 1200 BCE) remains.
Our initial proposal posited two primary research questions related to urban development and collapse through the use of remotely sensed archaeological site data: 1) Was the urban collapse at the end of the Early Bronze Age (EBA ca. 3600 to 2000 BCE) in the Levant caused by climatic change? 2) How has recent development impacted the condition of archaeological sites in regions made inaccessible through conflict? The first of these questions will be the subject of dissertation research by Rempel. The second question, and the work undertaken in this project, was designed to produce methods of site identification and condition assessment leading to an inventory of EBA and MBA sites in the northern Levant for addressing the first question.
Our work was accomplished in two phases, which are discussed in detail below. In brief, we report on our efforts to develop automated site detection with ImageJ, and our site selection process. We describe our methods of land classification and present the results as applied to our site sample. We document changing conditions on 82 archaeological tell sites in Lebanon, which have remains from the Early and Middle Bronze Ages. These sites have varying degrees of impacts from sources as diverse as agricultural expansion, fertilizer extraction, warfare, and urban development. We begin with a discussion of the research that informs our study.
Over the past generation, archaeological research in the southern Levant (primarily Israel, the West Bank and Jordan) has revealed several cycles of settlement aggregation and dissolution starting in the Early Bronze Age (ca. 3600 to 2000 BCE) and continuing through the Ottoman Period (1517 to 1918) (LaBianca 1990). This research has been possible because of large-scale archaeological survey and excavation projects in the region, and the compilation of national-scale archaeological databases (Palumbo 1994, Savage 2007) that enable settlement pattern research. Over the last several decades, investigation of settlement trends during the Bronze Age (c. 36001200 BCE) has indicated a much different picture of settlement than expected. These differences have been attributed to many factors: Geography, climate, trade, interregional conflict, and ethnic affiliation. Within this context, cyclical and sweeping episodes of abandonment occurred in the Levant during the greater Bronze Age.
The Early Bronze IV period (c. 2300-2000 BCE) represents the first urban “collapse” and forms the chronological focus of this proposal. Using data from Jordan and Israel, previous studies of this period have attempted to grasp the nature of this regional collapse through settlement pattern analyses (Dever 1989, Falconer and Savage 1995). However, these studies are typically isolated geographically within modern political boundaries. It is unclear how or whether these changes are manifested in the northern Levant (roughly Lebanon and south-western Syria); it is equally unclear whether the observed disintegration of the region’s first urban settlement system is the result of environmental or social factors. Moreover, no such research has been conducted on the geographically contiguous regions to the north in the northern Levant. Since it is generally assumed that there is a material cultural affinity within the greater Levant during the Bronze Age, a better understanding of regional responses to cyclical change ought to be found in settlement studies that transcend modern political boundaries.
Such an understanding can be enhanced by addressing the first research questions: Can the urban collapse near the end of the Early Bronze Age (ca. 3600 to 2000 BCE) in the Levant be attributed to climatic change (cf. Rosen 2007, Weiss et al. 1993)? A prolonged period of drought occurred in the Near East toward the end of the EBA (Issar and Zohar 2004: 106), whose effects extended as far south as Egypt (Stanley et al. 2003), but whether it caused the urban collapse is still not well established. If climate change is a factor in collapse, similar changes in northern and southern settlement trajectories should be observable at the beginning of the Early Bronze IV period and again at the beginning of the Middle Bronze Period. If supra-regional, adverse climate change is causal to collapse at the end of the 3rd Millennium B.C.; there should be expansive evidence for this in settlement pattern changes in the Levant (e.g. abandonment, site size decreases, etc.). While wholesale abandonment and destruction of settlements has been documented in the southern Levant, there is no consensus on climate change as a causal factor. And settlement patterns in the contiguous region to the north remain to be characterized. If settlement patterns in the northern Levant demonstrate a similar and concurrent trend with those in the south, a stronger case could be made for climate change as a causal factor. A large body of accurate, regional archaeological site data is required from the northern Levant to address these issues on a comparative basis, but the northern Levant has been largely cut off from archaeological research for more than a generation because of wars and political developments.
The past thirty years have been a period of explosive growth of population, urban areas, agricultural fields, and infrastructure throughout the Middle East that directly impact cultural heritage sites and the archaeological record. The Lebanese Civil War and several incursions into southern Lebanon by the Israeli Defense Forces (IDF) and the Syrian army have also contributed to the destruction of environments and archaeological sites. The expansion of agricultural land, warfare, and development has severely impacted the condition of archaeological sites in regions made inaccessible through conflict. Lebanon does not have a comprehensive, national scale archaeological database capable of tracking site conditions through time or providing efficient decision-making support for development projects so as to minimize the impact on known archaeological sites. The extent to which recent development and conflict has impacted diminishing archaeological resources in the region has therefore been unknown. Thus, the modern problem of rapid development and site destruction threatens our ability to answer questions of a long-term, archaeological nature.
On the world scene, archaeology produces major new sources of cultural heritage data and material remains that require innovative methods for study, interpretation and public presentation. To take advantage of the growing body of such data, the project has researched enhanced methods of remote archaeological site prospecting and attribute extraction, validated known, but incomplete, information acquired from earlier archaeological publications, and placed information in an online database that promotes open access and preservation planning. The new data acquired and the cyberinfrastructure in which it has been stored provides a workable model for researchers from a wide range of fields dealing with cultural heritage to collaborate, discover and monitor resources. In an era of rapidly expanding population and urban development, the methods accomplished here can provide mechanisms to monitor archaeological site conditions over time and lessen the impact on cultural heritage resources by careful planning and significantly enhance site preservation and development potential in the Mediterranean basin. Furthermore, by uniting the information acquired through remote sensing with archaeological site metadata from many disparate datasets and organizations, this project has dramatically improved the ability of researchers to ask large-scale, cross-border questions of the archaeological data, providing fresh new insights into one of the most culturally meaningful regions on Earth.
Archaeological research based on tell sites (deep, multi-layered sites that frequently have long occupation spans) in the Middle East has a long history but there has been very little information compiled on attributes of many of these sites in a broader, regional scope (Menze et al. 2005, Sherratt 2006). Locational and especially metric data (site sizes, configurations, etc.) have either been lacking entirely, or are difficult to access without actually revisiting the sites. In particular, very little data exists on tell dimensions, and locational information may be in error, sometimes by hundreds of meters. Equally unfortunate is the fact that damage to sites has accelerated in tandem with infrastructure growth, housing development, agricultural expansion and warfare.
Because of intermittent conflicts in the region and the difficulty of travel, very little archaeological fieldwork has been conducted there in the past thirty years, though recently, several excavation projects have resumed at sites such as Tell Burak (Kamlah and Sader 2003; Sader 2012) and Khamid el-Loz (Heinz 2004, 2010). Gunnar Lehmann (2002) published a comprehensive bibliography of archaeological sites in Lebanon and Syria; the database that accompanies the book includes 1,333 sites with a name, a point location, and a list of archaeological periods represented at each site. Marfoe’s (1978) dissertation includes an extensive listing as well. Unfortunately, both Marfoe and Lehmann were able to only provide site coordinates to the nearest one kilometer, and there were no other site metrics available. Their work is a valuable resource, but not especially helpful in precisely locating sites, assessing their condition, or planning their avoidance during development projects.
To address these problems and research questions, this project has conducted remote archaeological site prospecting and condition assessment with two methods that utilized Landsat TM, ASTER CORONA, and Google Earth satellite imagery from Lebanon and southwestern Syria. Collected over a period of about forty years, these image sources document changes in land cover and development that have occurred on archaeological sites. Initially, we planned to use site polygon centroids to perform a nearest-neighbor analysis in order to match remotely-sensed polygons to published site points, identify sites by name, correct their point coordinates, and record site sizes. However, we found that this step was best done by hand. This will help us update a listing of known sites from Lebanon and Syria whose site names and periods of occupation are known, but whose locations are known only to the nearest one km Lehmann (2002). The amount of site deterioration was assessed by comparing the degree of development on sites from the late 1960s-early 1970s up to 2010, thus quantifying specific aspects of global land cover change related to development on archaeological sites. Through the data sharing plan, the project has provided mechanisms to make the results available to cultural preservation planners and the public through a portal-based website, the Mediterranean Archaeology Network (MedArchNet) and its initial node, the Digital Archaeological Atlas of the Holy Land (DAAHL – http://daahl.ucsd.edu), which provide tools for heritage planners that aid in the preservation of cultural heritage.
Under the supervision of the PI, Rempel was to expand and refine the procedures described above, and apply them to CORONA, Landsat, and ASTER imagery of the northern Levant. These techniques were refined to optimize speed and efficiency in tell spotting and extraction of spatial parameters. Rempel used Lehmann’s (2002) and Marfoe’s (1978) site catalogs as the basis for assessing the results of the procedures, comparing the known site inventory to that developed by the remote sensing methods. The project used the approximately forty-year time span represented by the imagery to ascertain the extent of development and other impacts on the sites detected, and refine the initial site inventory data by correcting site locations and adding site size and condition information. These enhanced site data were placed in the Digital Archaeological Atlas of the Holy Land (DAAHL) to provide tools by which cultural heritage professionals can help plan new infrastructure in such a way as to avoid adverse impacts to significant archaeological resources.
The original proposal identified several major steps in the work to be accomplished:
The first four items listed above were accomplished in two main phases of effort. In Phase I, we acquired and preprocessed CORONA imagery, further refined the methods for automated site extraction, and, finally, employed hand methods to identify sites and match them with published locations. The CORONA imagery was cut into one-quarter degree tiles, and placed on the GAIA Lab’s website ( http://gaialab.asu.edu/home - the “Georeferenced CORONA Images” button) for other researchers to download.
In Phase II, we created a subset of archaeological sites from the larger inventories, corresponding to Early and Middle Bronze Age tell sites in Lebanon. We then examined each site carefully in georeferenced CORONA, Landsat, ASTER, and Google Earth imagery, establishing accurate site boundaries and site centroids. Buffers of 100 meters were digitized around each site’s boundaries, so that we could monitor changes in the critical areas just off-site in our sample. The site and buffered regions were digitized in ArcGIS, assigning one of four main land classifications to each group of pixels; a series of statistical analyses were run on the raw data, presented in detail for each site in Appendix A. Images from our four main sources were created with site boundaries and buffers superimposed, and 1970 vs. 2010 land classifications were added in the CORONA and Google Earth imagery. These were converted to 640 by 480 pixel images at the same scale, and are presented in Appendix B. Finally, the sites were either added to the Digital Archaeological Atlas of the Holy Land, or, if they were already in the database, their information was updated to reflect our results. All the imagery we generated for each site was included in the DAAHL database.
The availability of satellite imagery from a variety of recent and older sources, available at reasonable or no cost, has allowed analysis of spatial attributes of these sites, especially where degradation has occurred in the last several decades. This study has used recent Google EarthtmASTER and Landsat multiband imagery and CORONA satellite imagery, declassified in the 1990’s, to identify and analyze the area of the northern Levant that includes Lebanon and southwestern Syria.
Landsat imagery has supported archaeological research for some time, though it has not always been used for site prospecting. For example, Custer et al (1986) developed techniques that used supervised classification of Landsat data to generate maps of environmental zones that were related to environmental variables used in a logistical regression of known site and non-site locations, thus providing a probability assessment of an unsurveyed area's potential for containing archaeological sites. Menze et al (2006) found that Landsat imagery was not of sufficient resolution for their archaeological prospecting. Instead, they used SRTM data to identify archaeological sites. Philip (2007) and Ur (2007) used older, but higher resolution CORONA imagery to detect archaeological features in the landscape of the northern Middle East.
Sherratt (2006) suggested that higher resolution imagery was required for detailed analysis, and our results agree with his assessment. We found that for accurate identification of land use changes over time, higher resolution imagery than LandSat and ASTER was required; Google Earth imagery supplied the bulk of our data related to recent landscape changes, though Landsat and ASTER could, at times, help pinpoint when specific changes occurred.
Richardson and Hritz (2007: 319) applied CORONA, Landsat and ASTER imagery and other products successfully to identify archaeological sites and ancient canal structures in central Mesopotamia. They report that CORONA images have been effective because they were contemporary with the major ground surveys of the time, prior to much of the significant agricultural development in the region, and they can be compared to more recent imagery. Landsat TM and ASTER imagery provided the means by which Richardson and Hritz detected natural vegetation and irrigated agricultural areas, especially in the infrared, could be differentiated from earth materials that might represent tells and drainage ways. Also, the ability to display the same imagery in a normal color rendition helped to distinguish subtleties in geomorphic and soil types in the study areas.
As stated in the original project proposal, the satellite imagery was used, in part, to determine and refine archaeological site characteristics within the Northern Levant (i.e. Lebanon and southwest Syria). Specifically, ancient artificial mounds or “tells” are targeted as features whose gross geographical and morphological attributes are either unknown or inaccurately recorded. These site types represent ancient nucleated towns or villages that were most commonly occupied during the Early and Middle Bronze periods (approximately 3500-1600 B.C.) and usually stand out against surrounding terrain in both elevation and size (Rosen 1986). In satellite imagery, esp. CORONA, bright pixel values and rounded shapes typify most tells which allows a reasonable assessment of the quantitative aspects mentioned above. In many cases, tell sites have been destroyed or built over, precluding reasonably accurate determinations of site sizes, shapes, and geographic locations. CORONA satellite imagery was selected for this initial analysis because it reveals the landscape as it was 40 years prior to subsequent development. This analysis was meant to provide accurate site sizes through digitization of site boundaries, as well as site locations by creating centroid points based on site boundary polygons.
In a pilot study in the north Jordan River valley, Rempel and Soto-Berelov (2007) used multispectral analysis of Landsat and ASTER imagery, and detailed analysis of CORONA imagery to identify sites. These images were classified by performing an ISODATA unsupervised classification of 20 classes. Rempel and Soto-Berelov then examined and edited these classes using the Spectral Signature Editor, essentially looking for possible tells. This was followed by a supervised classification using the spectral signatures derived from the unsupervised classification as a weighting factor. A non parametric parallelepiped first pass classification (done to narrow the number of possible classes to which each pixel could be assigned) followed by a parametric maximum likelihood classification was adopted. The resulting images were recoded into the desired categories (possible tell locations and non-tell locations. Rempel and Soto-Berelov then filtered out those areas that were smaller than the minimum mapping unit (based on the pixel size of the original images) and exported the potential tell locations into vector format (polygon). Since the tell locations in the pilot study area occur in the Jordan valley, any polygons that fell outside of the valley were eliminated from further analysis.
Rempel and Soto-Berelov used the Jordan Antiquities Database and Information System (JADIS, see Palumbo 1994, Savage 2007) database to test the success rate of their classification methods. In some respects, the JADIS database resembles the dataset produced by Lehmann for Lebanon and Syria; it is comprised of point data, associated with known site names and occupation periods, but site sizes and most importantly, site locations, are frequently quite inaccurate. The classification algorithms were applied on the three images of varying spatial resolutions to detect potential tell locations. Of these, between 19 and 25 matched sites included in the JADIS database. Of the three, CORONA obtained the highest number (25 of the 35 sites in the JADIS database were detected) because of its higher resolution, but Landsat and ASTER images also provided clear spectral signatures of more than half of the known tells.
In the pilot study, analysis of Landsat, ASTER and CORONA imagery of the eastern Jordan Valley demonstrated the potential for detecting tells and refining tell dimensions and locations for a known group of sites, and highlighted other similar features on the landscape as of potential interest. By comparison with the JADIS database some of these additional features were positively identified with other previously recorded tells by the independent means demonstrated here. The methods of analysis (multispectral classification and ImageJ), though still requiring refinement, has shown a utility of speed, processing power, and data output that will be useful in other image-based analysis contexts.
The methods used in the preliminary analysis of CORONA imagery in the Jordan Valley demonstrated utility in several aspects. Once the parameters of anticipated ‘particle’ attributes were refined (e.g. ranges for diameter, roundness, and pixel value), site form identification was achieved to a relatively high degree in three scales of investigation. Site sizes were approximated to varying degrees, depending again on the phase of analysis (i.e. scale). This appeared to be dependent on variability in image values that reflect different landscape forms / uses over larger regions. However it was found in certain cases that this method approximated tell sizes more accurately than indicated in published site reports (Palumbo 1994). Another, less emphasized outcome was the geospatial accuracy which could be assigned to post-analysis results. Through positive identification of particles, and automated quantification of particle surface area, the matter of assigning spatial coordinates becomes a simple task. Assuming a Cartesian coordinate system is applied to the imagery (projected UTM in the present case), and real-world scale is accounted for in ImageJ, all identified particles are accurately enabled for incorporation into further GIS analyses.
Rempel used CORONA imagery and ImageJ software to detect tell size and shape in the project study area, comparing them to a group of known sites digitized manually from a CORONA image that had been georeferenced based on Landsat, ASTER and SPOT images using ERDAS IMAGINE. ImageJ biomedical imaging analysis software (Rasband 2011) was used to semi-automate the identification of sites, particularly tells, and helped quantify the attributes mentioned above for further analysis. This was achieved through a subtractive process consisting of commands that have been compiled into a macro or script that is applied to each CORONA tile. The application of the ImageJ macro accordingly was meant to automate redundant processing command sequences while producing immediately usable results. A more detailed description of the application of image processing is presented below.
The conditions of each site were then assessed visually, along with surrounding landscape conditions at the time of imagery acquisition (i.e. June 8 1970). This will provide a baseline against which later remote sensing imagery will be used to determine later anthropogenic or natural alterations to archaeological sites and their surrounding environs. At the time of writing, this phase remains to be completed.
![]()
Figure 1: CORONA film strip (DS1110-2300DF007) showing Beirut, Lebanon at center.
CORONA imagery is delivered digitally as scans of the original developed film strips. The original film strips measure 5.53 x 75.69 cm and are scanned at 7 microns or 3600 dpi. (see Figure 1 below). Original resolution on the ground is nominally 6 feet or 1.83 meters at nadir, or the center of the image. Each scanned strip is divided into overlapping quarters that are approximately 300 MB in disk size each.
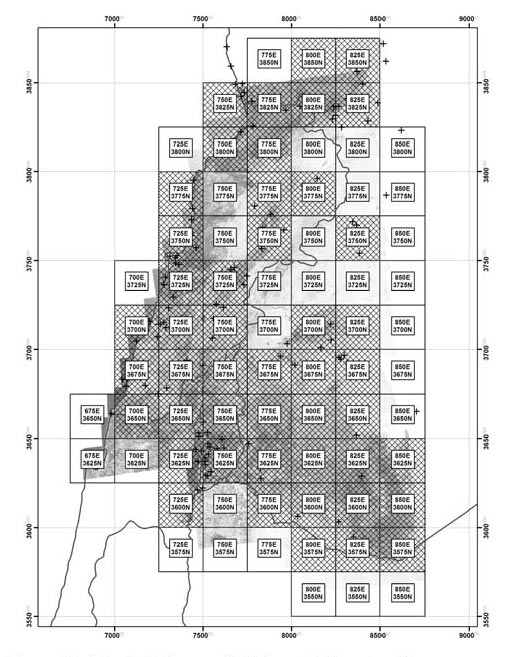
Figure 2: Selected tiles overlaid by grid showing all
georeferenced CORONA tiles. Each tile is 25x25 km
Grid is UTM Zone 36 North.
Scanned quarter strips covering all of Lebanon and Southwestern Syria from the Mediterranean to approximately 37 degrees E Longitude were orthorectified in Global MapperTM. Imagery from both SPOT 1 (Système Probatoire d'Observation de la Terre) and Google Earth datasets were used for ground control points to georeference the CORONA quarter images (e.g. road intersections, building corners, etc.). Once all 28 quarter strips were georeferenced to geographic coordinates (WGS 84), they were mosaicked together and projected to a Universal Transverse Mercator Zone 36 North, WGS 84 coordinate system. This allows accurate linear and areal measurements of archaeological features. Finally, the mosaicked and projected CORONA dataset was sectioned into manageable tiles in terms of actual disk size and spatial utility.
Each tile used in this study is 25 km2 with a slight overlap of approximately 100 meters on all four sides. The overlap was introduced in Global Mapper’s tiling parameters to prevent gaps of no image data between tiles. As outlined above, all tiles have been projected from a geographic coordinate system using the WGS 1984 datum to Universal Transverse Mercator (UTM), Zone 36 North. Segmentation into 25 km2 regions of the projected CORONA strips resulted in 77 tiles with the following characteristics:
Each image is named by its southwestern or lower left corner using the following convention: First three digits of the Easting and first four digits of the Northing, e.g. 775E3625N
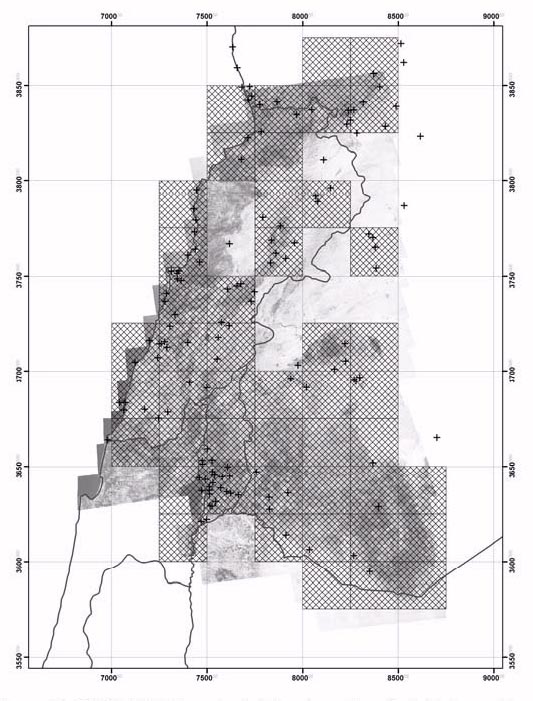
Figure 3: CORONA Tiles selected for phase I analysis in ImageJ.
Hatched tiles indicate tiles selected for analysis; crosses indicate
known Early and Middle Bronze sites from Lehmann 2002.
Each tile is 25x25 km. Grid is UTM Zone 36 North.
After several preliminary analytical image tests to optimize target region identification, a first-run, full-scale ImageJ analysis was applied to a select series of 25 km2tiles covering portions of Lebanon and Southwest Syria. Tiles for this phase of analysis were selected based on two criteria: 1) the tile significantly covers high potential landforms where tells or tell-like features are likely, e.g. valleys, coastal plain, flat uplands, and other non-hilly regions; 2) the tile contains at least several tell sites included in Lehmann’s (2002) database. Several tiles were excluded in this phase where fewer than two sites in Lehmann’s list, or landforms were considered to be of low potential or outside of the current study region, e.g. the Lebanon and Anti-Lebanon mountain ranges and Israel / Jordan. In total, 47 tiles out of 77 were selected for the Phase I analysis (figs. 2 and 3). Three tiles that contained one Lehmann site each were not selected to be analyzed in this phase.
Automatic processing of CORONA tiles in ImageJ took approximately 3:25 minutes each, using a compiled macro or script of ImageJ commands (See Appendix C). Previous manual processing of each tile normally took about 30 to 40 minutes and required an operator to be present at all times. Isolating areas of each tile that may represent tells required a combination of filtering and subtractive processes to both remove features that were too large or too rectangular to be tells, and to isolate those particles that fell within expected site size rang es as well as roundness. Apart from morphological characteristics, ImageJ analysis uses the difference in pixel values on tells from surrounding terrain to assist in isolating the boundaries of each site. When undeveloped, many tells tend to remain relatively barren (i.e. light pixel values) compared to irrigated fields within which they often lay (e.g. fig 10). This highlights contrast and enables a more accurate assessment of site boundaries. Figure 4 (below) shows the subtractive process of the ImageJ script as performed on a test region in the Jordan Valley.
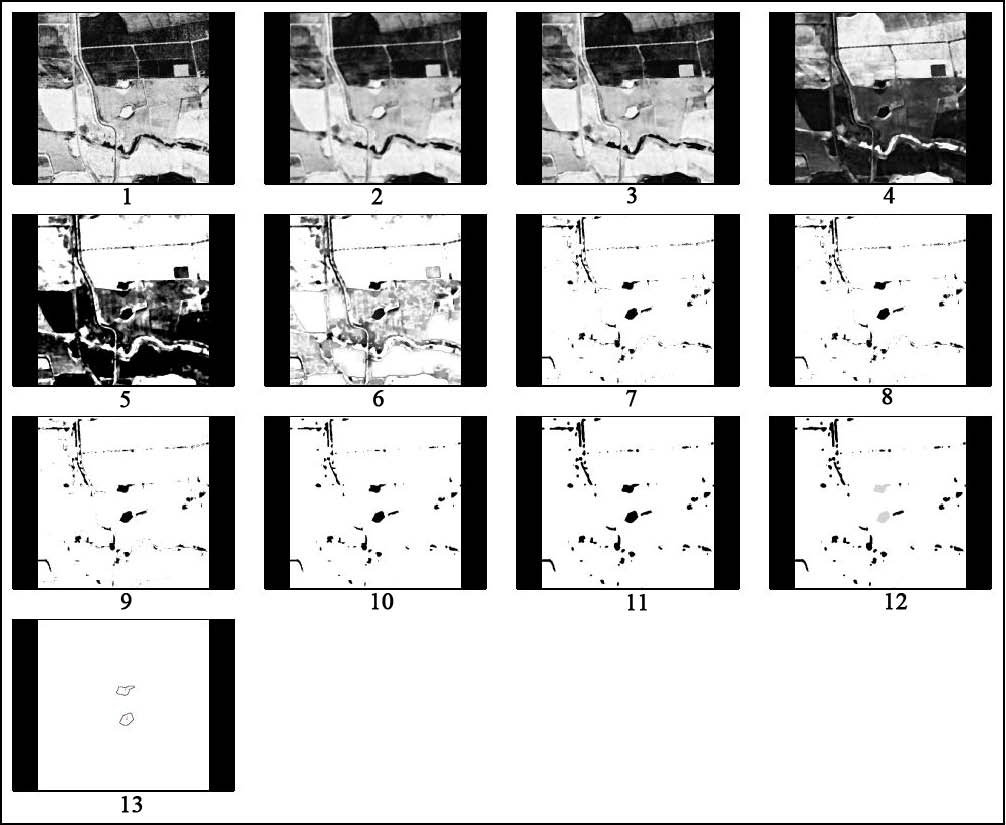
Figure 4: Sequence of CORONA analysis in ImageJ, showing the isolation of two known sites in the
Jordan Valley as part of the pilot study (Rempel and Soto-Berylov 2007).
The ImageJ macro allows all particles identified to be stored as an overlay on the original CORONA tile, the results of which are then viewed manually in ArcGIS. In addition, all quantitative data associated with each particle are automatically exported to a spreadsheet. This provides individual particle attributes (area, perimeter, roundness, coordinates) that are later attached to the particle vectors (polygons) in ArcGIS. Particle “masks” exported from ImageJ as geotiffs are converted to vector polygons in ArcGIS, which are then available to be potentially tied to site identifications. Manual assessment of particle identification was done at a 1:10,000 scale. This was deemed to be an appropriate scale that allowed observance of tell-sized features while allowing maximum coverage in one screen.
While it was not expected that the ImageJ macro would identify every known tell, especially using the same parameters for all terrain types and regions, this first phase of analysis did demonstrate promising value in the tell locations that were identified. Further refinements in this application should produce an increasing number of positive results.
A total of 13,986 particles were extracted from the 47 CORONA tiles chosen for this phase of analysis. Several bore particles in regions with no potential, such as the Mediterranean Sea, while others produced particles that were usually not considered for analysis because they lay outside the current region of study, e.g. in Israel or Jordan. Tile 775E3600N contained the highest number of particles (n=569), and tile 825N3850 contained the least particles (n=68). The latter covers only a small portion of the northernmost tile of available CORONA coverage. The blank space accounts for the low particle numbers, and not low potential for feature presence. Other low counts are similarly accounted for on the Mediterranean coast where tiles extend beyond the coastline.
Table 1: Summary of Phase I ImageJ Particle Analysis by Tile. | ||||
Tile | Particles | Known Sites | Positives / Partial | Potential |
700E3650N | 393 | 1 | ||
700E3675N | 358 | 6 | 1 | |
700E3700N | 147 | 4 | ||
725E3600N | 206 | 2 | ||
725E3625N | 227 | 2 | ||
725E3650N | 347 | 2 | 1 | |
725E3675N | 370 | 7 | 2 | |
725E3700N | 286 | 14 | 1 | 3 |
725E3725N | 241 | 8 | 1 | |
725E3750N | 132 | 7 | 1 | 3 |
725E3775N | 134 | 4 | 1 | 1 |
750E3625N | 323 | 16 | 1 | |
750E3650N | 276 | 7 | 2 | 1 |
750E3675N | 365 | 10 | 2 | |
750E3700N | 273 | 14 | 3 | |
750E3725N | 395 | 34 | 3 | 4 |
750E3800N | 274 | 3 | 1 | |
750E3825N | 90 | 3 | ||
775E3600N | 569 | 6 | 2 | 1 |
775E3625N | 393 | 8 | 3 | |
775E3650N | 313 | 8 | ||
775E3675N | 266 | 5 | 4 | |
775E3750N | 300 | 27 | 2 | 2 |
775E3775N | 114 | 9 | 1 | |
775E3800N | 364 | 8 | 5 | |
775E3825N | 495 | 25 | 2 | 2 |
800E3575N | 278 | 1 | ||
800E3600N | 579 | 1 | 1 | |
800E3625N | 379 | 2 | 1 | |
800E3650N | 252 | 2 | 1 | 1 |
800E3675N | 252 | 12 | 1 | |
800E3700N | 254 | 3 | ||
800E3775N | 324 | 13 | ||
800E3825N | 512 | 4 | 3 | |
800E3850N | 72 | |||
825E3575N | 353 | 1 | 3 | |
825E3600N | 318 | 1 | 14 | |
825E3625N | 279 | 6 | 1 | 3 |
825E3650N | 247 | 7 | 1 | 1 |
825E3675N | 309 | 3 | ||
825E3700N | 348 | 3 | ||
825E3750N | 371 | 4 | 2 | |
825E3825N | 230 | 5 | ||
825E3850N | 68 | 1 | 1 | |
850E3575N | 455 | 10 | 1 | 5 |
850E3600N | 258 | |||
850E3625N | 197 | 1 | 1 | 2 |
Total | 13986 | 316 | 21 | 82 |
In all, 316 known sites were used to determine particle identification accuracy, where “known” refers to published sites indicated in Lehmann 2002, Marfoe 1978, Thalmann 2007, Matsumodo and Wada 2001, Bonatz 2001, as well as supplementary observations stemming from Google Earth and NIMA (U.S. National Imagery and Mapping Agency) gazetteer data. Tile 750E3725N (Beqa’a Valley, Lebanon) contained the most known Early and Middle Bronze sites (n=34), while four tiles on the Eastern side of the study area contained no known sites.
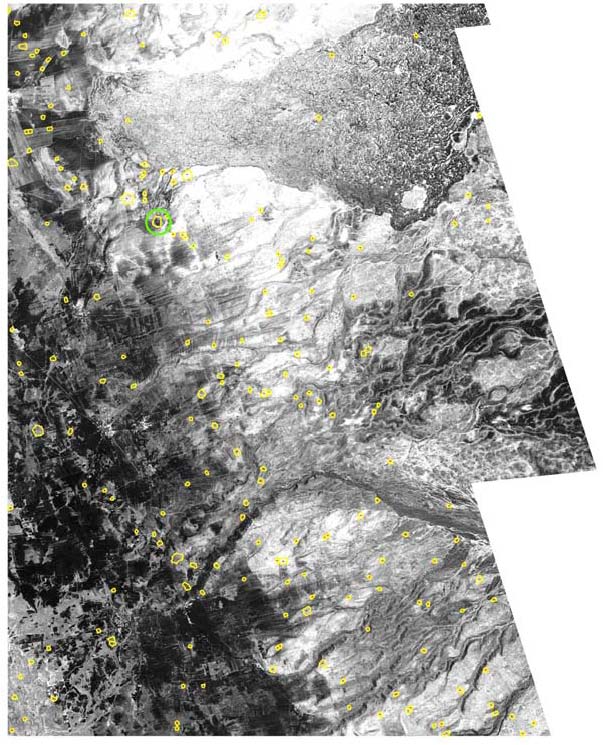
Figure 5: Tile 850E3625N showing location of Tell Hish
(green circle) in Southwest Syria. ImageJ particles shown in yellow.
Figure 6: Particle 51 [GIS55] from Tile 850E3625N partially
identifies Tell Hish whose center is indicated by the green circle.
ImageJ particles shown in red.
Of the known sites, 21 were either completely isolated (a positive ID) or partially isolated where only a portion of the site was isolated by an ImageJ particle (table 1, figs. 5 and 6 above). In some cases, more than one particle identifies portions of one site. Reasons for this are discussed in the section on technical problems with parameters used in ImageJ for this phase of analysis. For complete positive IDs the site was identified in a manner that is within acceptable margins of representation, i.e. the particle’s location, morphology, and size reasonably approximate a manual digitization of the site from the same imagery (figs. 7 - 10).
Figure 7: Tile 750E3725N. Located in the Beqa’a Valley, Lebanon.
Tell Taalabaya (Figure 8 below) lies in the northwest region.
Yellow circles indicate a 1km radius around each
site in Lehmann’s site inventory.
Purple dots indicate Marfoe (1978) site locations.
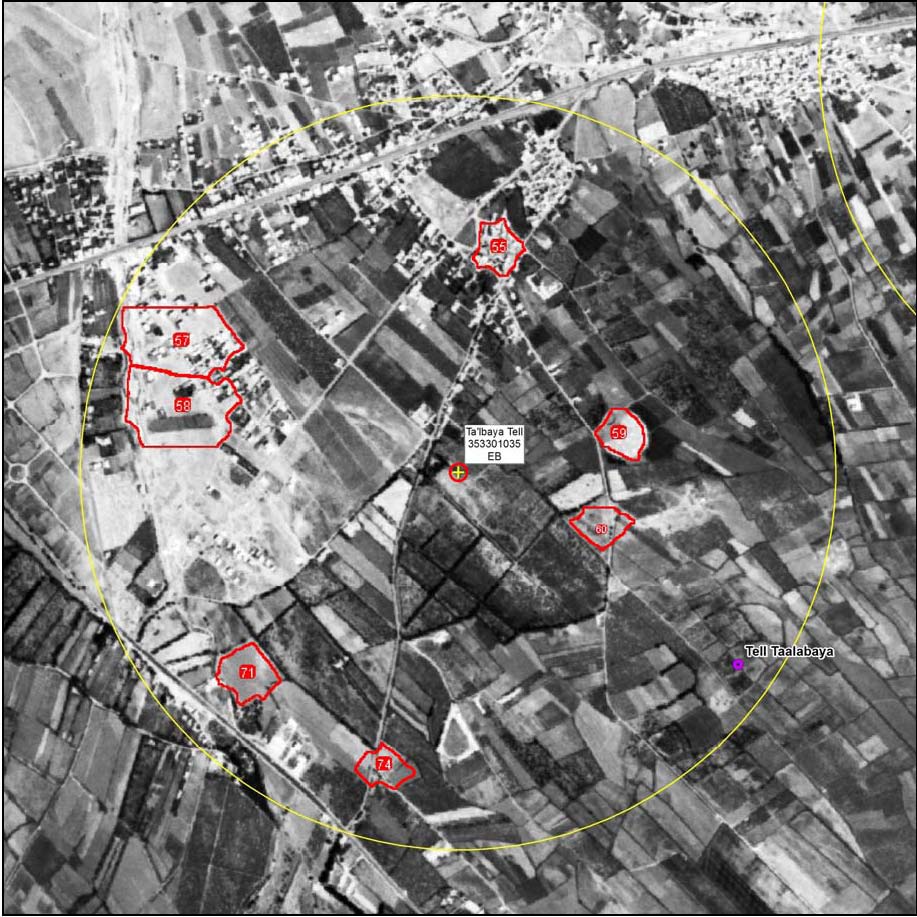
Figure 8: Particle 59 [GIS59] from Tile 750E3725N identifies
Tell Ta’alabaya approximately 500 meters to the East of Lehmann’s site location.
ImageJ particles in red.
Eighty-two particles were classified as “Potential” based on several criteria. Features or regions in the imagery that were identified based on ImageJ macro parameters and that are plausibly tell features, but are not previously recorded or published are included. Typically, a focus on potential tell sites is restricted to regions where tells are more likely to be visible (e.g. on floodplains surrounded by agricultural fields such as in Southwest Syria or in the Beqa’a Valley in Lebanon). As such, particles fitting the parameters, but occurring in hilly or mountainous areas are not considered potential tells because of the indistinguishable nature of tells from hills in these areas. A particle may be considered a potential site if the source publication point lies on a non-tell feature or surface, i.e. some distance from a reasonable tell candidate. In this case, a particle or particles that detect features that could potentially identify a known, but unpublished site are included here.
Figure 9: Tile 775E3750N in Beqa’a Valley, Lebanon.
Tell Allaiq (Figure 10) located in top center.
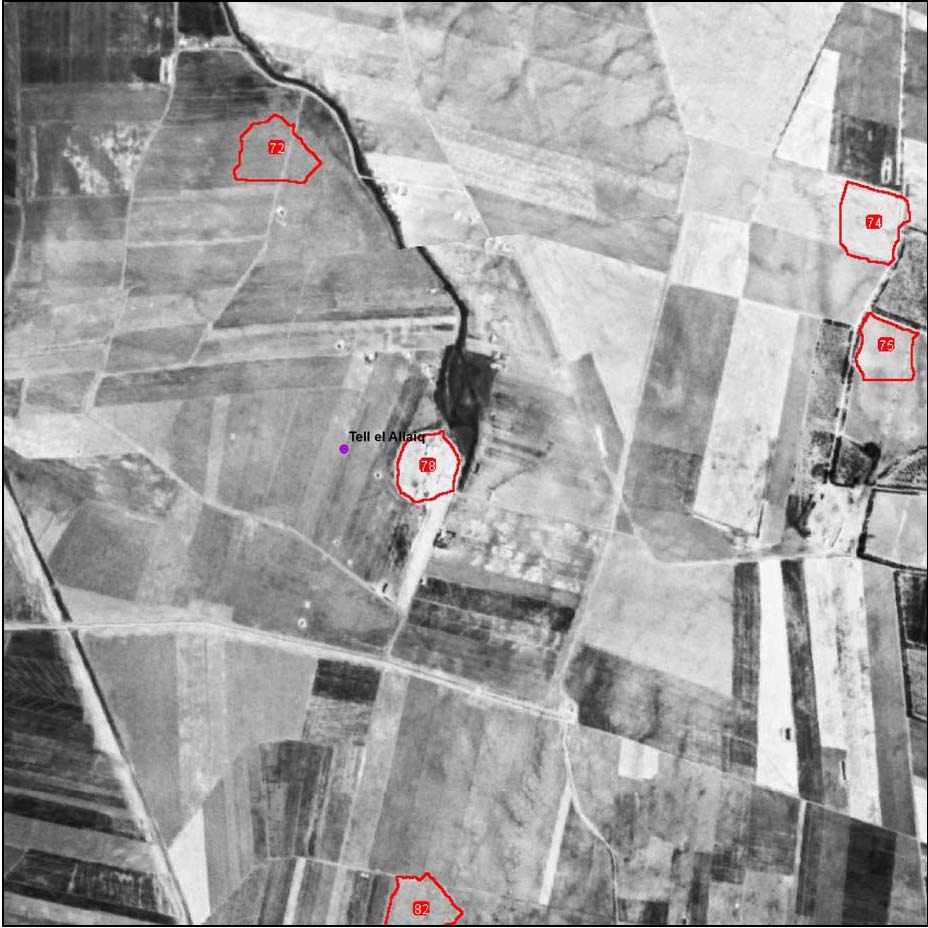
Figure 10: Particle 78 [GIS78] from Tile 775E3750N showing positive ID of Tell Allaiq.
Purple dot indicates Marfoe (1978) site location.
Since the primary goal in this analysis was to assess the potential for identifying, quantifying, and refining site locations, emphasis has been placed on comparing automated ImageJ identification with known sites, rather than on identifying unknown or unpublished sites. However, where tells are indicated by rough location by other data sources, we noted and recorded whether or not the site has been indentified in ImageJ. Because the appearance of tells is more variable (see Rosen 1986) in remote sensing imagery than other highly defined archaeological and modern features, confirming the presence of unknown or unpublished tell sites would entail extensive ground-truthing and is beyond the scope of this project.
Although the number of tell sites identified remains low compared to known or published sites it is felt that refinement of ImageJ parameters could produce better results given sufficient development time. This has been problematic up to this stage but a full-scale analysis has proven to be heuristic in identifying common or persistent issues in this analysis. The search for an effective, automatic algorithm for detection of archaeological sites on remotely sensed imagery is an intricate problem related to efforts to create an automatic crater counting routine for lunar and planetary exploration. But, because archaeological sites come in more shapes than circular impact craters, their automatic detection is even more intractable. Even the efforts to achieve an effective crater counting routine remain in the developmental stages (Vinogradova, Burl, and Mjolsness 2002, Asada et al. 2008). Manual methods of crater counting are still preferred (ASU Mars Space Flight Facility 2012). There are complications related to edge detection in different lighting conditions and the fact that the lunar or planetary landscapes being examined are palimpsests of craters within craters, etc. For similar reasons, we found that manual identification of sites.
In the next portion of this project, site conditions were recorded based first on CORONA imagery. This included identifying and recording areas of destruction and development (e.g. buildings, agriculture). Site conditions recorded for the time period at which the CORONA imagery was taken formed the base level against which subsequent site conditions were compared. The latter were undertaken using Landsat and ASTER datasets as outlined in the original project proposal, as well as more recent, higher resolution Google Earth imagery.
The first phase of this project focused on refining site locations and sizes using CORONA imagery and the biomedical image analysis software ImageJ. While some positive results were obtained, we determined that variability between tell site morphology/pixel values and the surrounding landscape was not differentiated enough to allow rapid automated site identification. Because of time constraints, manual digitization of all known Early and Middle Bronze site boundaries was necessary to lay the groundwork for assessing site condition changes.
Phase II utilized the resulting site data to address the main thrust of the project; a comparative analysis of site conditions in “time-slices” using both older and newer satellite imagery. It is presumed that the encroachment of development onto or near to archaeological sites generally increases over time. By development we mean the building of modern structures on or into existing sites, mining of sites for natural resources, damage due to terracing, cultivation, etc., and general degradation.
The presence of site alteration or destruction was assessed by visual examination of each site in all imagery sets and then quantified by the types of site development or preservation observed. Comparing the results of this classification in 1970 and 2010 imagery sets allows for a simple measure of development variation over time. Since archaeological remains are non-renewable, the net effect over time for any site is assumed to be one of increased site development in the form of urbanization, agriculture, mining, etc. Ideally in terms of archaeological site preservation, no significant deleterious change would occur within the time span between image acquisitions.
The data used in Phase II was limited to the region described geographically by the modern country of Lebanon. Early and Middle Bronze site locations of interest are drawn from Lehmann (2002) Marfoe (1978), Thalmann (2007), Matsumodo and Wada (2001), Bonatz (2001), and Copeland and Wescombe (1966). This group of sites was augmented in Phase II by the addition of 3 sites from a recent survey in Syria / Lebanon conducted by Ibanez et al. (2004). Of the 316 known sites used in the attempted automated identification in Phase I, 228 were assessed to be suitable for further analysis. This subset was chosen on the basis of several factors: 1. Potential for clearly identifying the location of the site in the CORONA imagery. 2. Reasonably clear site boundaries, particularly in the case of mounded “tell” sites. 3. Locations indicated by name in NIMA and Google Earth as “Tell ____” are unconfirmed as archaeological sites dating to the EB and MB periods, and are therefore excluded.
As noted in the discussion of Phase I data, site locations originating from Lehmann’s (2002) compiled database are accurate to only the nearest kilometer. In many cases, it was possible to visually confirm and adjust the actual location of a site based on both site morphology and by referring to original survey reports. Marfoe (1979) provides maps of sites originally recorded by Copeland and Wescombe (1966) in the Beqa’a valley which were scanned, orthorectified and digitized to allow the refinement of Lehmann’s site locations.
The boundary of each of the 228 sites in Lebanon and Syria was digitized in AutoCAD based on CORONA tiles and exported to ArcGIS format to allow attribute data to be appended (e.g. name, site area, perimeter length, etc.). For those sites with no obvious prominent features, and no indication in the literature of site size, a 1 hectare circle served as a site location and size proxy until further information can be provided. For the purpose of assessing site condition changes over time, these site “place holders” (n=67) were not useful and were excluded from the dataset. Subtracting sites outside of Lebanon proper reduced the final site dataset to 82 sites. These are shown in Figures 11 and 12.
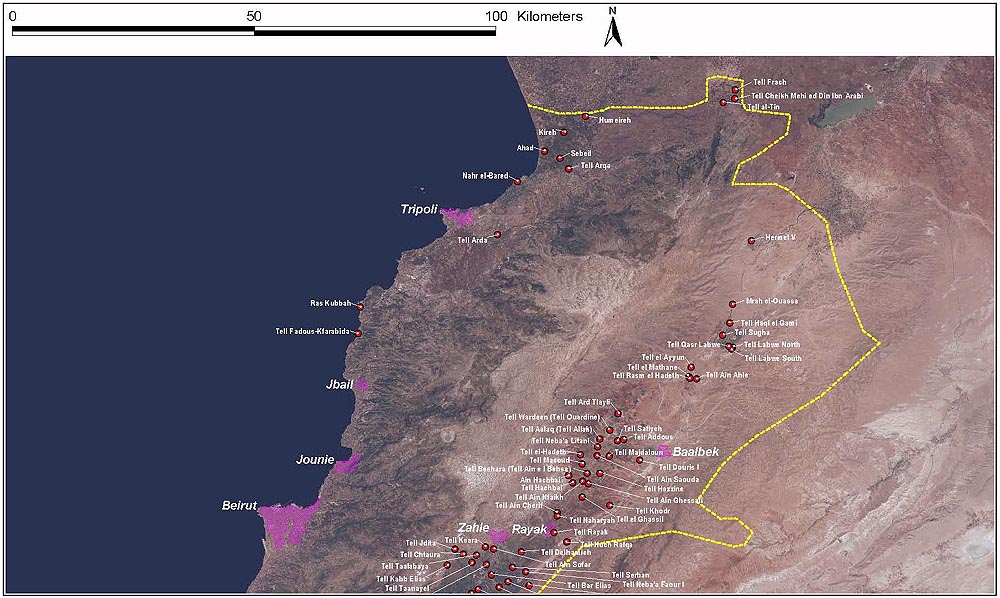
Figure 11. Sites in northern Lebanon included in the study.
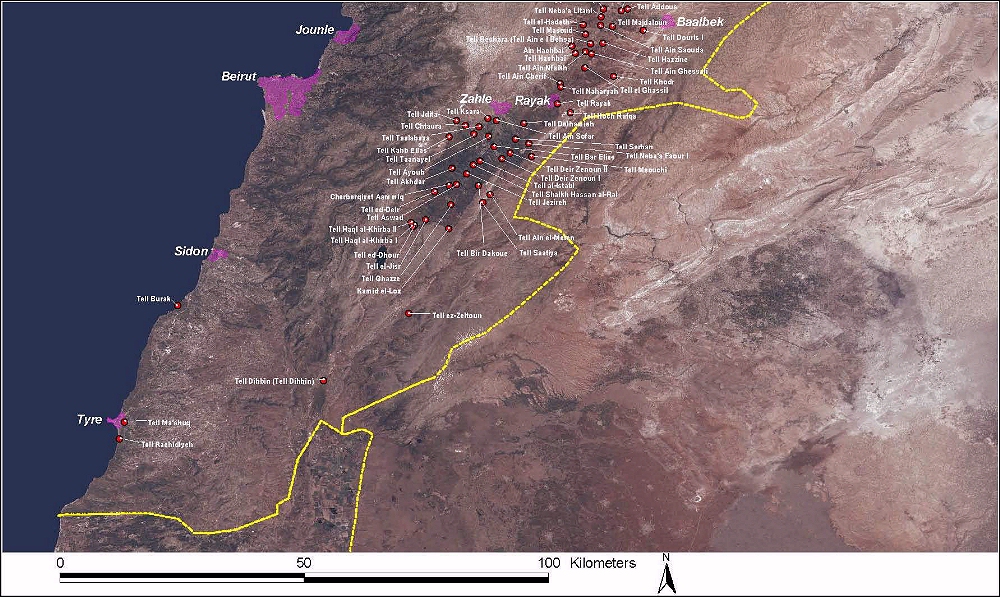
Figure 12. Sites in southern Lebanon included in the study.
Establishing diachronic changes in site conditions required a visual assessment of each site in the earliest possible imagery set, which, it is presumed, would demonstrate less site destruction/development than imagery taken several decades later. The CORONA imagery set was taken on June 8 1970 and forms the baseline of site condition assessment against which the Google Earth data set from approximately 40 years later was compared.
Each polygon representing a site boundary was buffered outward by 100m to produce a closed polygonal ring around each site. This was done to better assess not only the condition of the tell sites themselves, but the surrounding area which may or may not have undergone differential development. Typically, tell sites represent nucleated settlements with an outlying region of cultivation or other agricultural activity, therefore an assessment of site condition change properly subsumes at least a sample of this outer region.
Four classes of development were used to quantify changes in landscape cover on each site, and within the 100m buffer surrounding the site:
Each site and buffer was divided into these classes, and digitized in ArcGIS, first in the 1970 CORONA imagery. Classification polygons were tabulated in ArcGIS along with a calculation for area (in hectares) and exported to an Excel spreadsheet. Once all results for the 1970 classification were gathered, the process was repeated for the 2010 Google Earth imagery. Classification polygons from the 1970’s landscape status were overlaid and edited / replaced to reflect changes in each site environment over the intervening 40 years. Since there is an order of magnitude difference between site sizes in the sample, all values were converted to percentages for this study (A -43). The amount of change in each class was calculated for each site, buffer, and site and buffer combined. Z-scores were calculated on the percent change in combined site and buffers for each classification.
Appendix A presents the totals and percentages of each land classification for each site; summary statistics for all 82 sites are included on page A-43. Appendix B presents the digital images used in the analysis. Each archaeological site is shown in four satellite images: 1) CORONA (1970) with land classification; 2) Landsat TM (1997-2003); 3) ASTER (2001); and Google Earth (collected in 2012) with land classification.
The general results presented below must be contextualized with a discussion of significant sources of impact on specific archaeological sites in the sample group. The impacts include disturbances, where an impact is already observed on a site or in its buffer, and threats, where an impact is likely to occur on the site or its buffer. Serious disturbances or threats observed on sites or in their vicinities include those related to agriculture and different forms of development. The most significant impact from agriculture is plowing, with its demonstrated ability to destroy archaeological features and disturb artifact distributions. Observed disturbances and/or threats from development include activities related to mining (fertilizer extraction) and quarrying, archaeological excavation, warfare, and construction of housing and infrastructure. In some cases, especially warfare, we infer impacts from an examination of landscape features that are either on a site or its buffer, or in its vicinity (but outside the site buffer) in concert with documented military activity in the region.
Agricultural activity (including pastoralism) adversely affects archaeological sites in a variety of ways. Pesticides, trampling, plowing and fertilizer extraction (a form of mining, which will be discussed later) are among the most damaging.
Modern farming practices can leave residues of chemical fertilizers and pesticides in the soils, which contaminate archaeological deposits, even when these are not directly applied to a site, but essentially are derived from atmospheric distillation. “These global distillation processes appears to be most pronounced for organochlorine compounds, frequently used as pesticides, and are of intermediate volatility (Simonich and Hites 1995:1851). The direct consequence is that some organochlorides or their metabolites may be present in archaeological sites well removed from the point of use of the chemical compound (Thorne, Waldbauer and Nickens (1997: 42).
Trampling damage to archaeological sites in the Near East is a result of long-term use of a site for pasturage by ovicaprids. It affects surface deposits, breaking potsherds into smaller pieces, and causing edge damage to lithic specimens that make detailed analysis more difficult. For example, at two Early Bronze Age sites in west-central Jordan Savage and Rollefson (2001: 229-230) found that, “Traffic by sheep, goats, humans, and (in the past century) vehicles are al1 possible agents of alterations to the edges of flakes and blades that may not have been modified intentionally by the flintknapper. Thin edges, especially, might take on the appearance of ‘tools’ even though they were possibly discarded on the spot as being useless, and the small size of many of the pieces indicates an improbable status as a tool. Nevertheless, persistent traffic can very easily produce results that are difficult to distinguish from actual use-wear and real retouch, and this is particularly the case for retouched flakes and blades, utilized pieces, notches and denticulates, and even scrapers and truncations.”
These two sources of impact are not assessed in our sites, since their analysis requires sample collection on the ground. Impacts that occur on a larger scale, such as agricultural expansion and plowing are macro-level processes, which can be seen from satellite imagery. We will concentrate on these forms of Agricultural impact to our site sample.
Plowing a site creates a variety of adverse impacts, from widening and displacing the surface scatter, to mixing artifacts in the plow zone. In a series of experiments conducted over six years in the Acconia area of southern Italy, Ammerman (1985: 33) concluded that “…the site surface operates in effect as a sampling process with respect to material circulating in the plow-zone” and that “…local factors at a site, such as slope, can affect patterns of lateral displacement.” His work has been confirmed in experiments at the Ladybridge Farm site in England:
The results of this experiment have clearly demonstrated that material buried beneath the plough soil is being actively disturbed by the agricultural practices currently being followed at the Ladybridge Farm site, and that archaeological features are in themselves being truncated. This agricultural activity is part of the normal agricultural regime carried out year after year. More importantly this experiment has recorded the disturbance and displacement of Neolithic pottery from an in situ pit feature on the site. It has confirmed the observations made in the evaluation of Ladybridge Farm in 2004.
The experiment has also shown that the processes of displacement and truncation are far more complex than the authors had originally thought. Different levels of truncation were observed which were relative to the amount of wear on the plough shoes at particular points across the site. Other factors, such as depth of plough soil, the dryness of the soil and the nature of the subsoil may have also affected this pattern. It is clear that recorded surface distributions have undergone a far more complex redistribution throughout time through various farming practices than originally anticipated. In one instance this had a dramatic effect with material being moved up to 30m from their point of origin by post ploughing activity. Without a full comprehension of these practices it is difficult to see how artefact patterning within the plough soil can be interpreted at a level beyond general site/activity identification [Dickson, Hopkinson and Timms 2005].
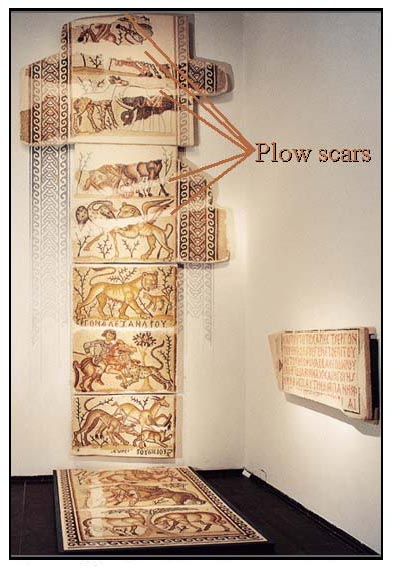
Figure 13. The Kissufim mosaic in
the Israel Museum, showing plow scars.
The opening of new areas for agriculture can have a particularly damaging effect on archaeological remains (Trow 2010). Frequently, the first plowing is done with larger implements, which deeply scour the landscape, destroying anything in the path of the plow. The well-known Kissufim Mosaic (fig. 13) is a case in point. “In June 1977 a tractor-driver at Kibbutz Kissufim on the coastal plain east of Gaza was preparing a new field for cultivation. Glancing back at the furrowed earth he noticed fragments of colored mosaic, and realized that he had inadvertently plowed across an ancient site. (Cohen 1980). The floor was dated to A.D. 576-578 based on a Greek inscription in one panel, shown mounted on the side wall in the picture. Savage was participating in an archaeological survey in the northwest Negev at the time, and saw the damage first hand, while Cohen was excavating the mosaic. Multiple plow scars had caused extensive damage to a significant portion of the floor.
Many of the sites in our research sample were impacted by agriculture by 1970 (see Appendix A). The summary statistics on page A-43 suggest at first glance that there has been only a small decline in agricultural land use in the intervening 40 years; the average change is only .808 hectares across all 82 sites and buffers combined. However, the average masks a considerable amount of variation from site-to-site; the standard deviation is 2.268 hectares for the change in the number of hectares under agriculture from 1970 to 2010. Agriculture has declined in the central Beqa’a Valley (Allam 2011), where many of our sites are located, but it has not done so everywhere in the valley—in some places it has intensified.
Instead of a steady decline in the amount of site and buffer area under cultivation, what we instead see are two trends; agricultural land use has intensified at some sites (e.g. Tell Frach, Tell Dibbin and Tell Deir Zenoun II), but declined sharply at others (Tell Meouchi, Tell Ma’shuq, and Tell Neba’a Faour I – discussed under Observed Impacts – Housing/Infrastructure Development). These examples are the most extreme cases, judged by the z-scores of the change in total site and buffer percentage devoted to agriculture (A-43). They are discussed further below.
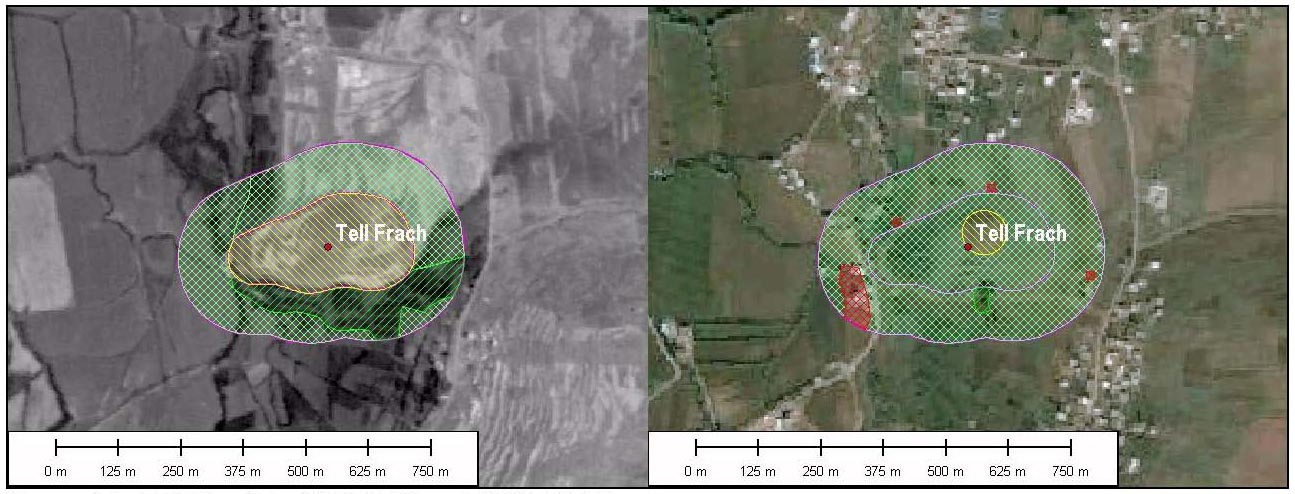
Figure 14. Tell Frach in 1970 (left) and 2010 (right).
A site with Pottery Neolithic B, Chalcolithic, Middle Bronze, and Roman occupations, Tell Frach (fig. 14, A-26, B-50) occupies a spur jutting out into a small valley in the far north of Lebanon. Though there was some evidence in 1970 of terracing in the vicinity of the site, the overall mound/spur appeared to be intact, and was classified as unaltered. The buffer was a mixture of agriculture and vegetation. By 2010 the unaltered area on the site had decreased to a small circle, and the rest was is in agriculture. Most of the vegetated areas in 1970 are now also being farmed, but there are a few buildings in the buffer, which are classed as development. Agricultural land use increased from 52% to 92% of the site and buffer areas combined in the 40 year interval (A -26). A comparison of the images from 1970 and 2010 also shows that there was quite a bit of residential development just outside the site buffer by 2010. It does not bode well for the site, since once development starts, it usually continues.
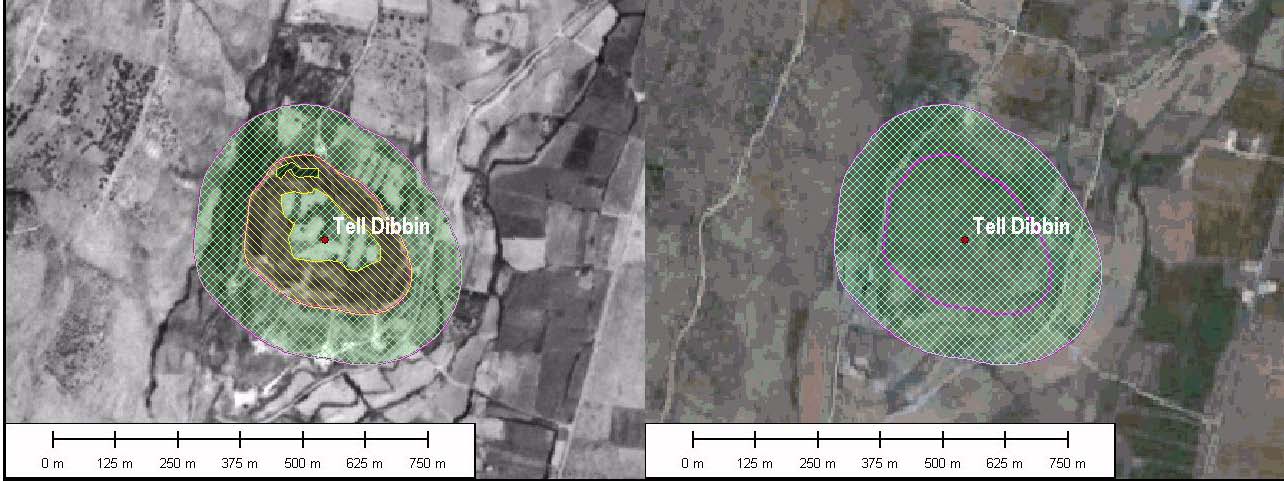
Figure 15. Tell Dibbin in 1970 (left) and 2010 (right).
A fairly large site (7.826 ha, with a buffer of 13.415 ha; total area 21.241 ha), Tell Dibbin (fig. 15, A-20, B-39) lies in east-southern Lebanon not far from the Israeli border. As long ago as the 1850’s (Robinson 1856: 375), the site was identified as the likely location of the Biblical Ijon (to which the Arabic A’youn, meaning “springs”, is related). The name survives in that of Marj A’youn, "meadow of springs," a well-watered, oval-shaped plain where the Litani River turns sharply westward to the sea. Tell Dibbin was located within the Israeli Security Zone from the 1980s through 2000, and is in the area that was heavily bombed by the IAF during the 2006 Hezbollah War. Two areas of vegetation and agriculture are visible on the site in 1970. The rest appears to be unaltered. The area within buffer is all agricultural. By 2010 the site and buffer are completely under agriculture, including the slopes of the tell itself. Agricultural land use increased from 72.6% to 100% during the 40 year period of our study (A-20).
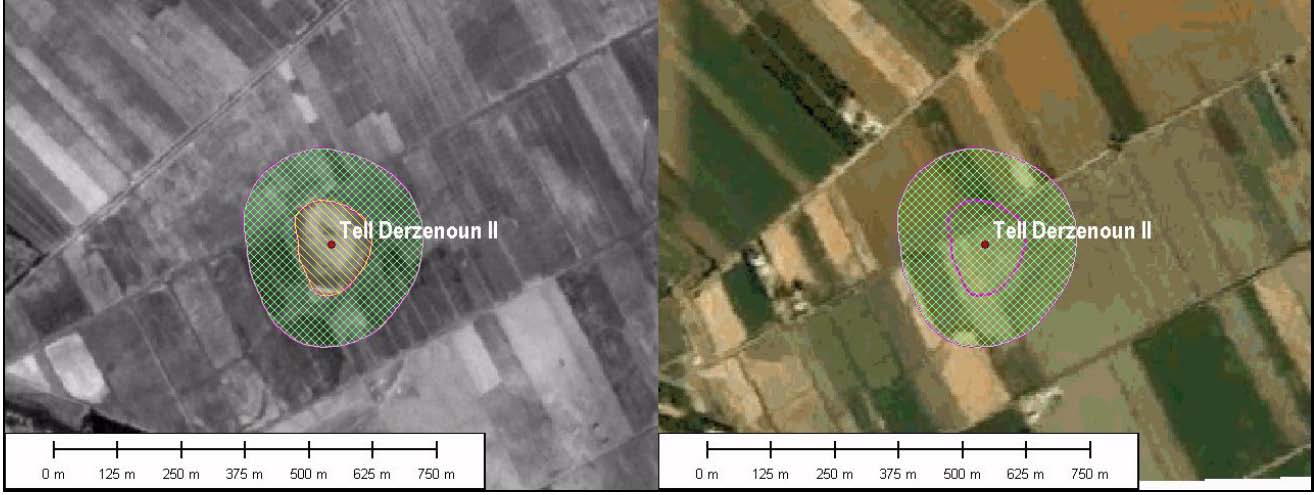
Figure 16. Tell Deir Zenoun II in 1970 (left) and 2010 (right).
With occupations identified from the Pottery Neolithic B, Late Chalcolithic, EB I, EB II, EB III, and Middle Islamic periods, Tell Deir Zenoun II (fig 16, A-20, B-37) is a small site of 2.115 ha, with a buffer of 8.471 ha, giving a total studied area of 10.586 ha. The site is located in the southern Beqa’a Valley, south of the city of Zahle. In 1970, the entire site appeared to be unaltered; it was surrounded by agricultural fields. By 2010, the entire site and buffer were under agriculture. This represents an increase from 80% to 100% of the combined site and buffer (A-20). It appears to have escaped damage during the IAF air raids in 1982 and 2006.
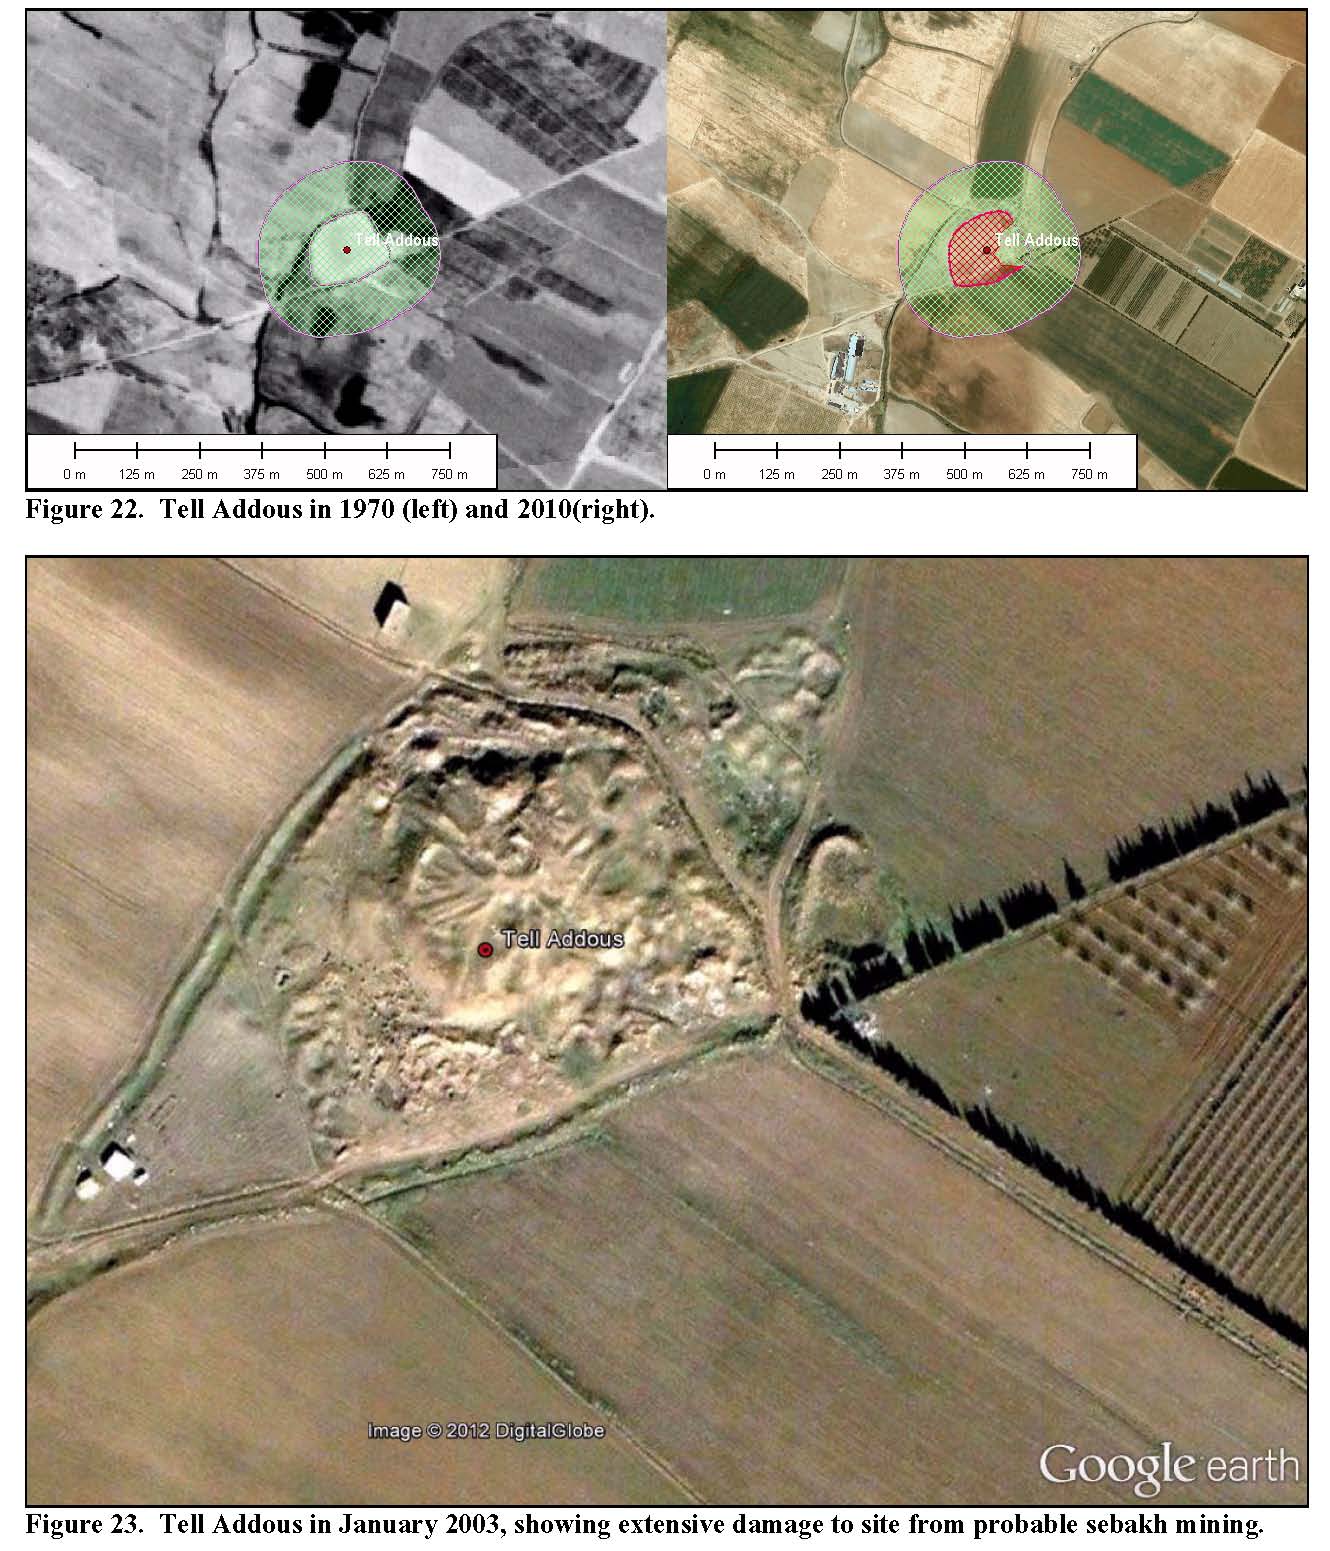
Other sites that have been most adversely affected by agricultural intensification in our study sample include: Tell Addous (A-8, B-14), which appears to have been bulldozed away, or perhaps completely mined for Sebakh (see below for a discussion of Sebakh mining); and Tell Naharyah (A-35, B-69) whose site and buffer were classed as 100% agriculture in 1970. The site could still be distinguished in 1970; by 2010, both site and buffer are still 100% agriculture, but the site appears to have been completely plowed away.
As noted above, observed disturbances and/or threats from development include activities related to mining (fertilizer extraction) and quarrying, archaeological excavation, warfare, and construction of housing and infrastructure. Each of these categories will be discussed in terms of its general impact on archaeological sites, and then specific examples from our site sample will be presented. Other than deterioration of excavated archaeological remains (discussed below), development is responsible for more damage to cultural resources than any other kind of impact:
Several national committees reported the widespread risk to archaeological heritage from development projects, such as earthwork constructions. Examples reported include: urbanisation (New Zealand, Turkey, Yugoslavia); road widening (Denmark, Germany, Slovakia, Turkey); railway building (Germany); dam constructions (China, India, Turkey); underground parking in historic cities (Switzerland); and modern agricultural deep ploughing (Norway, Denmark), which can be a special risk to earthwork sites. Much that is lost is either entirely sub-surface or unrecognised on the ground surface.
The archaeological heritage is impacted in a number of ways: destruction of entire or particular elements of past cultures or phases of human activity, particularly the earliest or less monumental manifestations; damage to the integrity of cultural landscapes by removing cultural features that are important archaeological evidence of the relationship between sites; potential damage to sub-surface remains by changes to the surrounding environment as a result of development constructions - the effects from changes to groundwater and to compression are not yet fully understood [ICOMOS/ICAHM 2002].
Development can lead to the complete destruction of archaeological sites, though activities related to construction, mining, and quarrying. Depending on the nature of the development, sites can be obliterated, such as Tell Addous (A-8, B-14), and Tell Naharyah (A-35, B-69) in the current study, which were completely destroyed by plowing or Sebakh digging. The operation of gravel and stone quarries has had a significant impact on archaeological sites in Jordan, such as the dolmen field at Al-Murayghat, which is being systematically destroyed by two gravel quarries (Savage 2010). If large buildings are erected on a site, their deep foundations can destroy centuries of archaeological deposits.
This is a pervasive problem in that development creates more development, especially where infrastructure, such as highways, dams, shopping centers, and power plants are concerned. Such facilities attract people, who attract more infrastructure. The damage is even more extensive in unrecorded or unregulated environments. Furthermore, the destruction of archaeological heritage is most likely to occur in the absence of prior recording of this heritage. ICAHM recognises this threat:
ICAHM Charter 1990. Article 4: ...A duty for developers to ensure that archaeological heritage impact studies are carried out before development schemes are implemented, should therefore be embodied in appropriate legislation, with a stipulation that the costs of such studies are to be included in project costs. The principles should be established in legislation that development schemes should be designed in such a way as to minimise their impact upon archaeological heritage.
However, ICAHM is aware that this standard is not always met. Despite many countries having requirements to record archaeological heritage, others report a lack of: regional surveys of archaeological heritage (Austria, Norway Sami sites, Panama); environmental impact studies, including archaeological heritage, as part of approval requirements for development projects (the Czech Republic noted some developers are prepared to destroy a site and pay the fine, rather than undertake archaeological investigation); geographic information systems and inventories that record archaeological potential and sensitivity (Lebanon). [ICOMOS/ICAHM 2002].
Fertilizer digging can destroy part or all of an archaeological site, and is classed with development in this study, as it is a form of mining, though it is done for agricultural purposes. “Sebakh” (Aramaic for “dry earth”) is comprised of midden soils and decomposing, unfired mud bricks. It has been a traditional source of fertilizer in the Near East and Egypt, probably for millennia:
For manuring proper the fellaheen use rubbish heaps or "Koms.” These are the remains of numerous ancient towns and villages; they are rich in nourishing salts. This refuse soil, called 'Sebakh,’ is being quickly used up; it contains about 12 per cent, of salts, namely, saltpetre, soda, and ammonia. Great care must be applied in using this refuse, as the soil contains numerous injurious substances. Usually 20 tons of this refuse earth are put on one feddan [an Egyptian unit of area equal to 1.038 acres], and as it is considered ownerless it only costs the carriage. At times this refuse earth is so short of nitrogen that it does not pay the transport on the backs of camels. As the dwellings of the Egyptian farming people have been made since ancient times of mud-bricks, that have never been burnt, but have been merely dried in the sun, the weather soon pulverizes them, and this dust mixed with the remains of the food of both men and animals, gives a most valuable manure. [Schanz 1913: 215].
Sebakh digging could occasionally reveal important archaeological remains so that later excavation and study could be conducted. In 1887 in the Egyptian village of Et-tel el Amarna, a local woman found a cache of over 300 cuneiform clay tablets while digging for Sebakh. Weigall (1908) reported "Last year in the sebakh digging near the temple of Edfu a pink granite stele was found dedicated by Taharqa in the sixth year of his reign ...In the sabakh diggings at Edfu there was also found a grey basalt statue of Thoutmosis II and III ...In the sebakh digging at the temple of Dendereh there was recently unearthed a part of a colossal crystalline limestone statue of a woman..." At Oxyrhynchus in Upper Egypt, Flinders Petrie, the noted British Egyptologist, observed, "Another column suggests a third colonnade but this region is so deep in Coptic and Arab rubbish that it would be very costly to clear. The work will be done before very long by the natives digging for nitrous earth. Even in a month or two I saw a huge crater cleared out close to the town exposing an early Arab mosque which would soon be destroyed. The rate at which the sabakh digging goes on is astonishing." (1922:36). “The work of the sebbakhin at archaeological mounds did, however, have the effect of stimulating interest in the sites they dug; for in the course of their removal operations, ancient artifacts came to light and many of them found their way onto the antiquities market. Among the most common finds were papyri, which were soon coveted by both collectors and museums. These papyri inspired two English scholars to undertake the first serious archaeological work that had ever been done at Graeco-Roman sites in Egypt. In 1895 Bernard Pyne Grenfell and Arthur Surridge Hunt arrived in the northeastern Fayoum with the intention of excavating for these valued documents" (Gazda 1983).
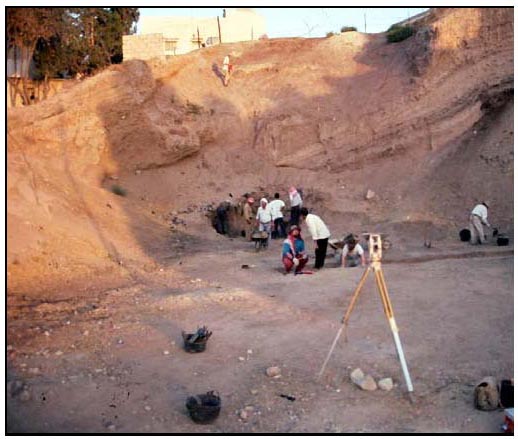
Figure 17. Field A, Tell Madaba, Jordan, showing the
extensive area removed by fertilizer digging in the 1980's.
Picture July, 1996, by S. Savage.
In spite of its sometimes revealing important archaeological finds, the damage done to sites was so extensive that in the Anglo-Egyptian Sudan, the colonial Department of Antiquities included in the 1905 Antiquities Act, “The Governor of a Province shall have power to forbid digging for sabakh in any place except under such restrictions as are thought fit and any person digging in any forbidden place shall be liable on conviction to a term of imprisonment not exceeding one month or to a fine or to both.” (Governor General of the Sudan 1905). A permit was required to dig sebakh in Egypt. “As was common practice in Egypt in the late nineteenth and early twentieth century, local farmers obtained government permits to remove soil from the mound to use as fertilizer (sebbakh). Archaeological sites provided an excellent source of sebbakh because decomposed organic debris creates a soil very rich in nitrogen” (Gazda 1983).
A secondary effect of fertilizer digging on archaeological sites is to spread the artifacts contained in the midden soils over a wide expanse of farmland (Wilkinson 1982). Bintliff and Snodgrass realized that the most satisfactory explanation for the carpet-like distribution they observed through walking 40 square kilometers of Boetian countryside was that “…prehistoric, ancient, medieval, and early modem farmers in Boeotia systematically collected animal and human excrement, together with household rubbish, and regularly spread it across the cultivated landscape as fertiliser. Leavening this mainly organic material was some ceramic debris-broken pots, house tile-which thus found its way continuously into those sectors of the landscape most assiduously cultivated (1988: 508).”
Fertilizer digging from archaeological sites is not a practice confined to the past. In 1996, Harrison et al. (1996) conducted excavations at Tell Madaba, a site in the center of the modern Jordanian city of Madaba. Their excavation in Field A took advantage of an extensive portion of the southeastern slope of the lower mound (fig. 17), exposed during clearing activity by tobacco farmers in search of crop fertilizer in the early 1980s, which revealed an vertical section, more than 8m in height, of the site's depositional history.
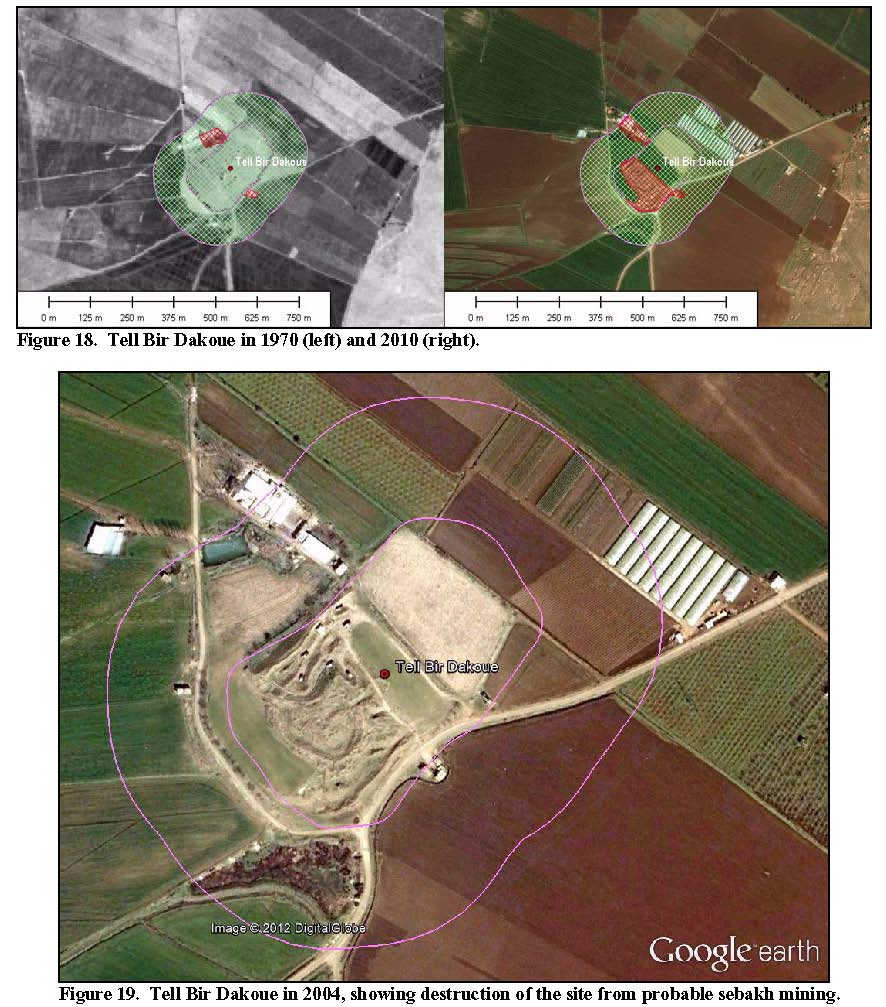
With confirmed occupational deposits from the EB I, EB II, EB III, MBIIb/c, LB II, Iron I, Iron II, Hellenistic, Roman, and Byzantine Periods, Tell Bir Dakoue (fig. 18, A-17, B-32) is a small site (4.062 ha, 10.949 ha buffer, total 15.011 ha) located in the southeastern Beqa’a Valley. The site was completely under agriculture in the 1970 CORONA image, as was the buffer except for two small areas of development off the NW and SE edges of the site. The developed area on the NW had already begun to expand, perhaps by as early as 1997--clearly indicated by the light colored pixels in the Landsat and ASTER images. March 2004 Google Earth (fig. 19) imagery shows trucks and heavy equipment mining the southwest side of the site, probably for sebakh. This area is now classed as developed; the northeast part of the site is still agricultural.
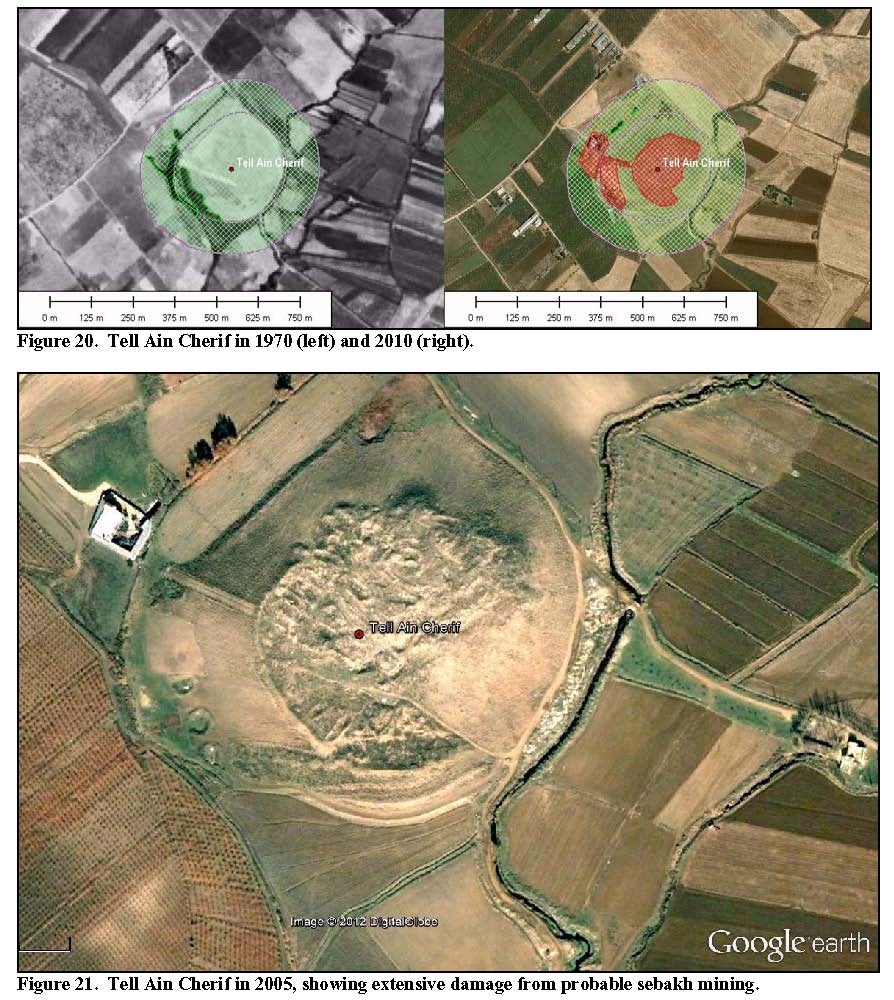
Located north of the town of Rayak in the central Beqa’a Valley, Tell Ain Cherif (fig. 20, A-9, B-16) has confirmed archaeological remains from the Late Chalcolithic, EB I, EB II, EB III, EB IV / MB I / Int. Bronze, MB IIa, MB IIb/c, LB I, LB II, Iron I, Iron II, Persian (Iron III), Roman, Byzantine, and Ottoman Periods. It is a large site (8.297 ha, 13.453 ha buffer, total 21.750 ha) which we classed as agriculture and vegetation in 1970. The site was reported to be intact except for surface plowing in 1966 by Copeland and Wescombe. Recently there has been development on west edge of the site and the buffer, mostly at the expense of vegetation. By 2005, the site appears to have been extensively looted or mined for sebakh (fig. 21). The disturbed areas are classed as developed in 2010 for this reason.
A small site (1.809 ha, 8.098 ha buffer, total 9.907 ha) located northwest of Baalbek in the Beqa’a Valley, Tell Addous (fig. 22, A-8, B-14) has confirmed archaeological deposits dating to the EB, EB II, EB III, EB IV / MB I / Int. Bronze, MB IIb/c, Roman, Byzantine, Early Islamic, and Middle Islamic Periods. The site is very clear in CORONA imagery, and was entirely in agriculture in 1970, along with the buffer. However, 2003 Google Earth imagery shows the site being mined extensively for sebakh (fig. 23—the depth of the shadow at the 12:00 position indicates how deeply the site was being mined. By 2010 it appears that most of the site proper has been bulldozed away. This area is classified as developed. The remainder is agriculture.
It is ironic that poor archaeological conservation practices constitute the greatest developmental impact to sites:
The most widely reported risk to archaeological heritage is the lack of maintenance and conservation of in situ excavated remains. Damage to archaeological heritage is almost certain when excavated cultural features are left exposed without any management plan or resources for their protection, conservation or management. Sub-surface structures and artefacts generally deteriorate very rapidly when exposed to new environmental conditions above ground. The impacts range from physical deterioration - such as the cracking and spalling of monumental stone structures, and the weathering and crumbling of mudbrick features - to the erosion and slumping of unexcavated cultural layers, as well as vandalism and looting. The consequences include the destruction of the features that are excavated, together with damage to unexcavated evidence [ICOMOS/ICAHM 2002].
Partially excavated archaeological sites that have not been backfilled attract looters like an open wound draws flies. This is especially true in periods of governmental or social instability, and Lebanon has not been truly stable for any length of time since before the collapse of the Ottoman Empire (see Traboulsi 2007). Therefore, its archaeological sites are especially vulnerable. Since large areas of the country have come under the influence of various militias, and the writ of the central government holds no real power, it is not surprising that looting should be a particular problem (Bogdanos 2012).
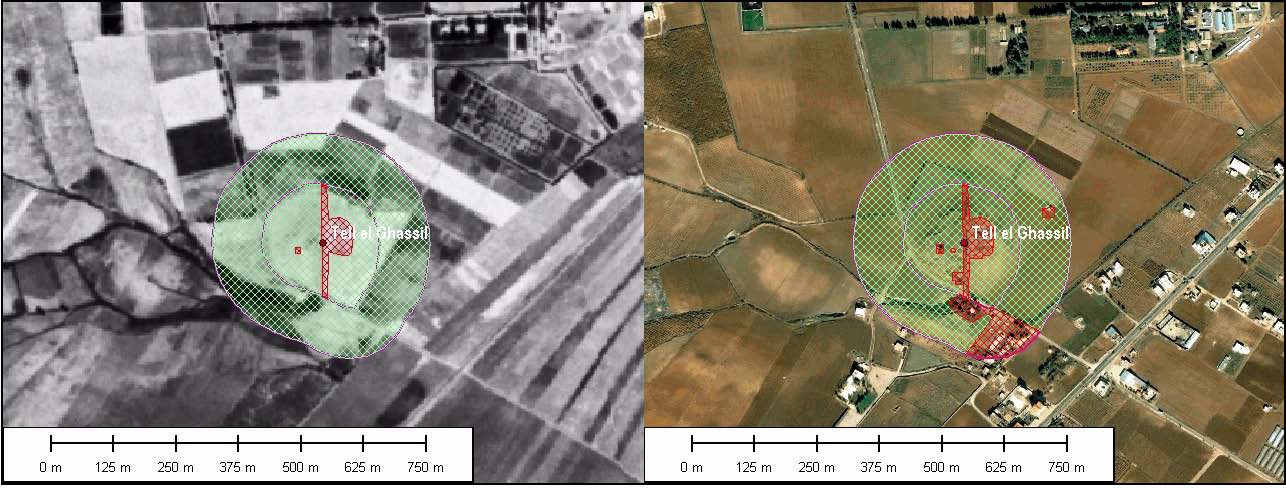
Figure 24. Tell el-Ghassil in 1970 (left) and 2010 (right).
Located northeast of Rayak in the central Beqa’a Valley, Tell el Ghassil (fig. 24, A-23, B-44) is slightly larger than 4.311 hectares, with a buffer of 10.682 ha, for a total examined area of 14.993 ha. The site has confirmed archaeological materials from the Late Chalcolithic, EB I, EB II, EB III, EB IV / MB I / Int. Bronze, MB IIa, MB IIb/c, LB I, LB II, Iron I, Iron II, Roman, and Byzantine Periods. Excavations at Tell el-Ghassil were conducted by Dr. Dimitri Baramki and Dr. Leila Badre with the help of the American University in Beirut Museum team and archaeology students, between 1956 and 1974 (Baramki 1961, 1966; Baranski 1964; Doumet-Serhal 1996). Eleven archaeological levels ranging from 1800 to 600 BC indicated that Tell el-Ghassil was a rural agrarian site from the Middle Bronze Age through the Iron III Periods.
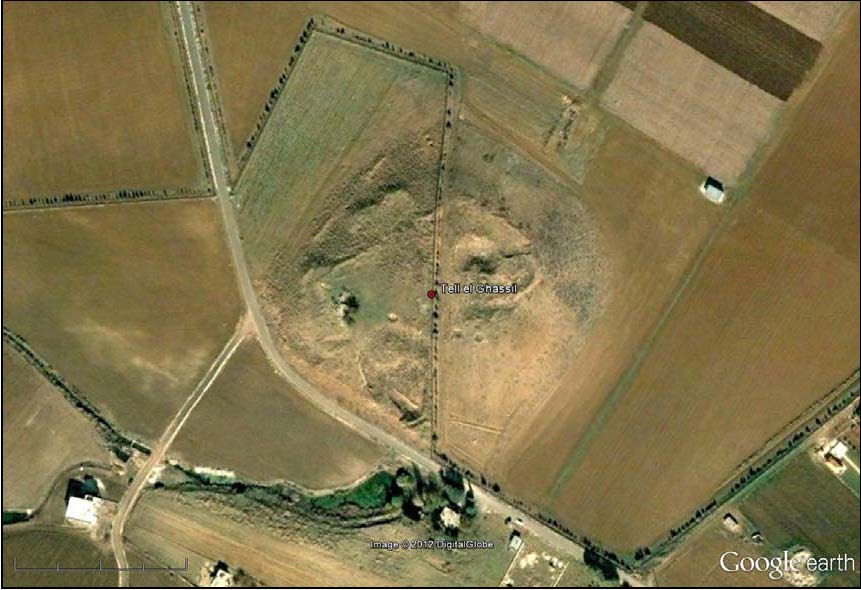
Figure 25. Tell el Ghassil in 2009, showing unfilled excavation units and looters' pits (the pockmarked areas).
Copeland & Wescombe (1966) noted light cultivation on the rest of the site. In figure 24, the excavated area is classed as developed along with the road that bisects the site, and the remaining site is classed as agriculture. By 2010, Google Earth shows encroachment of agriculture fields on N and S sides of site, and increased development in the buffer. Note that the excavated area at the 7:00 position on the 2010 image does not appear to be present in 1970; the area was still under agriculture at that time, but excavations from 1910 to 1974 were conducted in this part of the tell.
In a satellite image from Google Earth dated August 19, 2009 (fig. 25), the unfilled excavation units are clearly seen, as is a severe amount of erosion around their edges (especially around the large units in the center of the site and on the southern side. Three small pits between these larger excavation units may be looters’ holes. Comparison of the 2010 image with the later image in Figure 25 shows that the development at the 5:00 position on the site is a very recent phenomenon.
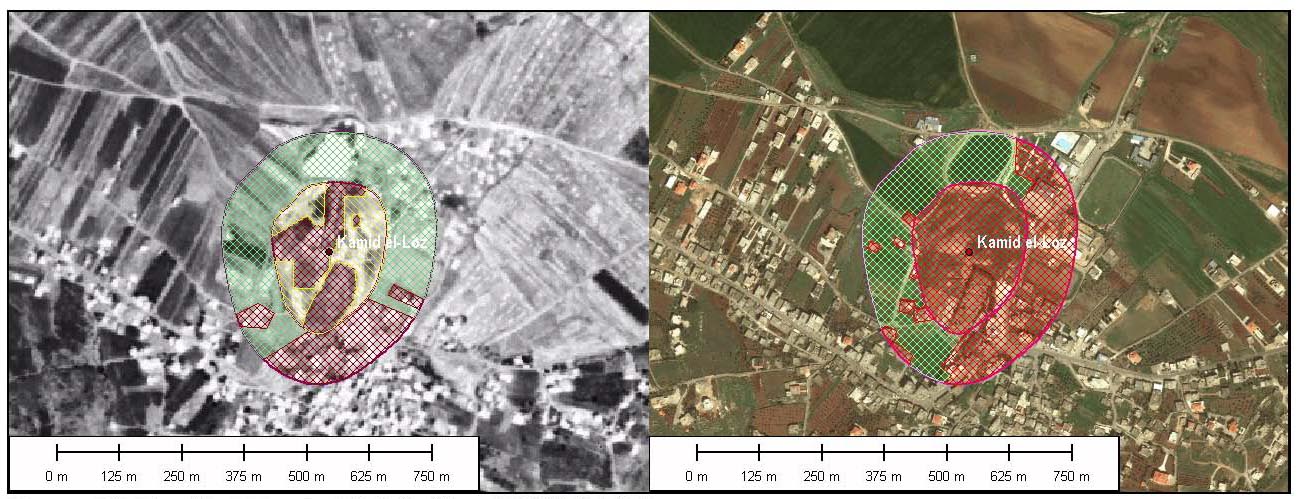
Figure 26. Kamid el-Loz in 1970 (left) and 2010 (right).
The site of Kamid el-Loz (fig. 26, A-4, B-7) is located in the southern part of the Beqa'a Valley; it is a medium-sized (5.32 ha, 11.591 ha buffer, total 16.911 ha) tell. About 26 meters of archaeological deposits contain confirmed materials dating from the Paleolithic, Neolithic, Chalcolithic, EB, MB, LB, Iron Age, Persian (Iron III), Hellenistic, Roman, Byzantine, Islamic, and Ottoman Periods. The site appears to have been the city of Kumidi in the Amarna letters, which was a residence of Egyptian administrative officials in the Late Bronze Age. Probably the most important finds were documents written in cuneiform on clay tablets dated to the 14th century BC.
Excavations were conducted from 1963 to 1981 by a German team under the direction of R. Hachmann from Saarbrücken University (e.g. Hachmann and Kuschke 1966, Hachmann 1982, Echt 1984). They focused on several areas: 1) the late Bronze Age Palace near the center of the tell; 2) two temples north of the palace (fig. 27); 3) a domestic quarter and workshops on the northern slope of the tell; 4) Late Bronze Age fortifications on the western side of the tell. In 1997 a new project began under the direction of M. Heinz from the University of Freiburg (Heinz 2010). The renewed excavations by the Freiburg team have not yet reached the Late Bronze Age levels.
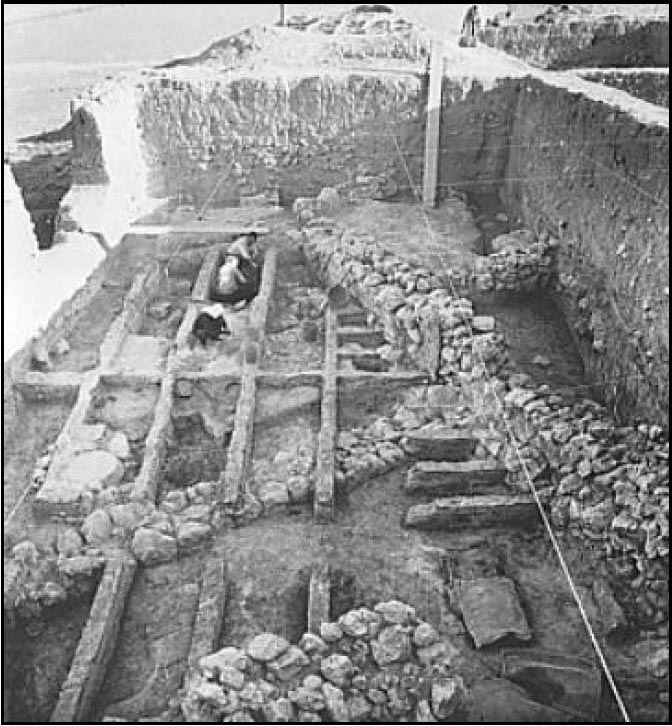
Figure 27. Excavation of the temple complex at Kamid el-Loz.
Photograph by A. Mauer.
Source: http://www.detail360.de/projekt/grabung-tell-kamid-el-loz-libanon-
mitarbeit-b-prof-dr-hachmann-universitaet-saarbruecken-pjid_1737.htm.
The site was very well published by the Hachmann team, and known internationally as one of the most important Late Bronze Age settlements in Lebanon; the discovery of cuneiform documents at the site dating to the Amarna Period, and the mention of the site five times in the Amarna Letters of Pharaoh Amenhotep IV - Akhenaten (1352-1336 BC) made it an obvious target for looters during the chaos following the Lebanese Civil War (fig. 28). Robert Fisk (1991) reports that
...the entire hillside with its repository of ancient civilisation - the fruits of 19 years' work by German archaeologists - has been destroyed. The earth is still there, but it has been cut away with bulldozers and earth-diggers, the surviving low walls of its 3,500-year-old houses ground to pieces by treasure-hunters.
Dr Gunther Krause, director of the Kultur und Stadthistorisches Museum at Duisburg University, took part in the excavations and continued to visit until just before the Israeli invasion. He has been back since and was appalled by what he discovered. "The tell is finished," he said. "The people there have destroyed their own heritage. Everything has gone, the walls, the stone tombs, the ancient roadways. They have bulldozed until they have got down to virgin soil. It's not only at Kamid - it's everywhere in the Biqa'. Bulldozers and dynamite and metal detectors have been used on all the major heights in the valley, even around Baalbek which was always protected before now. They were quite successful in finding metal coins but they destroyed almost all the Persian and Byzantine sites."
According to Dr Krause, looters have made off with bronze figurines from a temple, sacrificial daggers, seals, cuneiform tablets and highly decorated pottery, all of it now in the hands of the international art market. "Kamid el-Loz was a Chalcolithic and Bronze Age tell," he says. "There had been some looting already, but after the Israelis left, in 1985, up to 50 people came and 'worked' the tell. In one area, there were late Bronze Age temples, one on top of another down to the Middle Bronze Age. They cut through every one and they no longer exist."
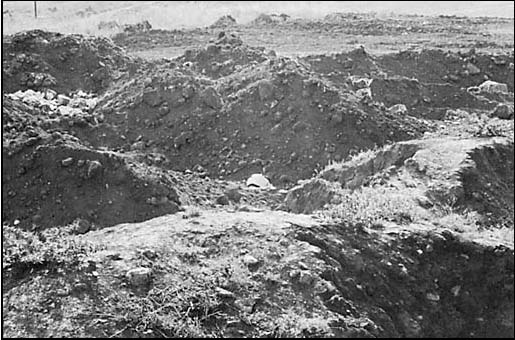
Figure 28. After the looting at Kamid el-Loz. Photograph by Robert Fisk (1991).
Dr. Krause is not exaggerating. A visitor who did not know the history of the hill would assume that much of it was a building site, piled with fresh earth and rocks. For the diggers are still at work, organised - according to villagers - by five families in Kamid el-Loz who sell the artefacts from their homes. [Fisk 1991].
The more recent excavation team has little left to investigate. Google Earth imagery from May 25, 2004, shows the extent of the looting (fig. 29). The new excavation units are clearly seen on the northern part of the tell. The remains of looters’ pits, though grassed over in this image, give much of the site a lunar-like appearance.
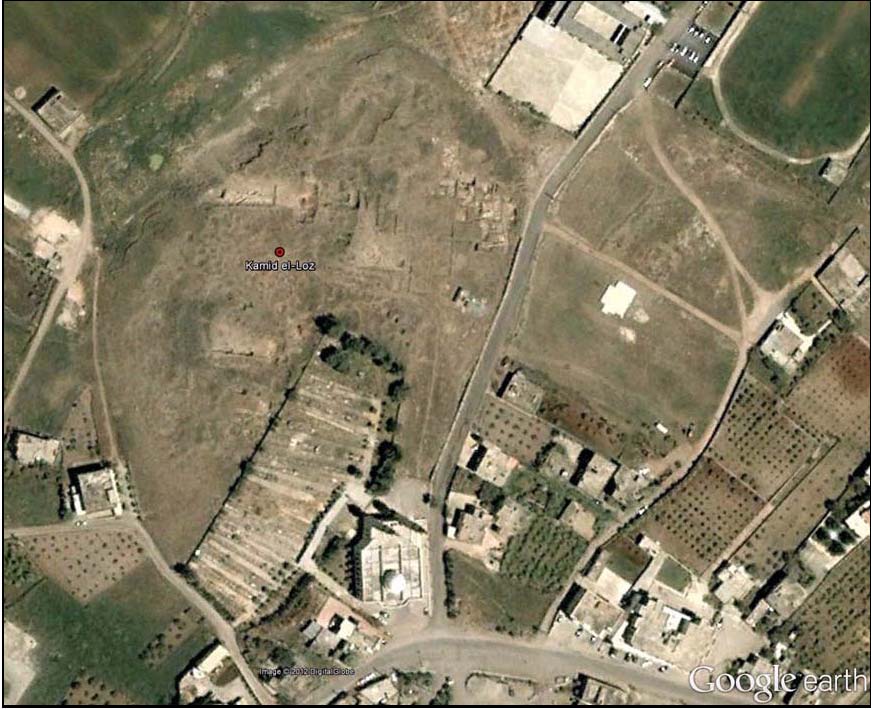
Figure 29. Kamid el-Loz in May, 2004, showing extent of looting (the pockmarked areas)
and the location of recent excavations by the University of Freiburg.
The impacts related to archaeological excavation and looting (as well as other development) in Lebanon are particularly troubling because of several factors: lax or antiquated laws, lack of enforcement, lack of resources in the responsible agencies, corruption, and the wars and instability in the country.
The current Lebanese antiquities law was established under the French Mandate in 1926, replacing the Ottoman law; it was amended in 1933, expanded in 1966 and further modified in 2008. The laws provide for protection of listed archaeological sites and objects, and special protection for places that are declared to be “monuments” (UNESCO 2012). While, in theory, anything created in Lebanon can be regarded as cultural property, and therefore under the protection of the law, in practice, protection extends only to registered (i.e. “gazzetted” sites, objects, or monuments). This has created a significant loophole in the protection system. Non-monumental sites “...are ignored and neglected, because they do not receive the same recognition as larger or older sites. Risks include a lower level or no statutory protection, or limited resources for protection, management and conservation, because that country allocates greater status and protection to monumental archaeological heritage than less visible and less imposing archaeological features.” ICOMOS/ICAHM (2002). This is a recognized problem in Lebanon.
In addition to the lack of effective protection for un-gazzetted or non-monumental sites in Lebanon, there is no provision in the law for preemptive archaeological survey, which could identify sites in advance of development, and help mitigate adverse impacts to them. “…there are no archaeological surveys for the whole of Lebanon, and no systematic surveys of ancient sites for the South, Mount Lebanon, or the coast. In the mountains no surveys have been carried out whatsoever, other than of the Roman temples in the 1920’s by a group of German archaeologists” (Cochrane 2003).
The lack of preemptive legislation is seen as a result of lack of government policy or concern. Helen Sader, professor of archaeology at the American University of Beirut, observed that “if there was a government policy concerning archaeological heritage, and if they were serious in protecting the Lebanese national heritage, we would be in a better position. Our major problem is that we have authorities who are not interested in protecting or planning for our national heritage. This is the least of their responsibilities, and archaeology is at the bottom of their priorities” (Quoted in Cochrane 2003).
Furthermore, the Directorate General of Antiquities lacks the resources to carry out the tasks for which it is responsible:
Sader explained that “it is a problem of politics, and of the internal apparatus of the department of antiquities. In 1966, the Directorate General of Antiquities was created, but this law fell short of its aim. It could not build a department of antiquities to meet the challenges of growing archaeological activity in the country, and the law came with very modest objectives. The then-director of antiquities had his own traditional conception of archaeology, meaning every dig was run by one man and his army of workers. In this law, he thought that five trained archaeologists and 10 trainee assistants were enough to cover the five administrative areas of the country. This is still the policy today, but 15 archaeologists are only good for one dig, not for the whole of Lebanon. “In comparative terms,” she said, “the Museum of London has 200 archaeologists working within the British capital alone.” A further example of under-resourcing is that there is one archaeologist working in the Bekaa Valley, which alone, according to a survey carried out in the 1960s, has 505 sites. “We do not have the required human potential for archaeology, and the second problem is money,” Sader continued. “Archaeology is a public enterprise, and is the responsibility of the department of antiquities. Even if you do not have enough people in your department, you can always hire freelance workers. Neither the Lebanese administrative laws allow that to happen, nor the department of antiquities has the means for such a policy,” she said [Cochrane 2003].
The political situation that has existed in Lebanon since the 1970’s discourages effective policing of illegal activities, such as clandestine excavations, trafficking in antiquities, and the like. Many parts of Lebanon have not been considered safe for officials to inspect. The presence of armed militias such as Hezbollah, who are hostile to the government, make it very difficult for officials to do their jobs outside of Beirut.
The antiquities laws seem to be rarely enforced. Trade in cultural objects “exists de facto and is tolerated or simply ignored by the authorities” (Fraoua 2012). “Threats to Tyre's ancient cultural heritage include development pressures and the illegal antiquities trade. А highway, planned for 2011, is expected to be built in areas that some deem archaeologically-sensitive areas. А small-scale geophysical survey indicated the presence of archaeological remains at proposed construction sites. These sites have not been investigated. Despite the relocation of а proposed traffic interchange, the lack of precise site boundaries confuses the issue of site preservation” (Triposo 2012).
The laws have been flaunted even in Beirut: “About 70 archaeological sites have been allowed to disappear without a trace, either physical or photographic. The main reason for this, in our opinion – unless there is a concealed reason – is that those carrying out the excavations have not yet acquired enough of the technical capacity, academic methodology, or functional expertise needed to publish the findings. …What is being done to Beirut today can be described...as a large-scale cultural massacre” (Karam 2012). Following the destruction of a Phoenician-era port facility in downtown Beirut, a writer for Al Akbar English observed that, “Beirut's heritage sites are under continuous threat from real estate developers seeking to wash away the city's 5,000 year old history. Activists and archaeologists have long campaigned to protect the city's heritage sites from development. But Lebanon is also one of the most corrupt countries in the world, and real estate companies enjoy strong political backing” (Al Akbar English 2012). With so much corruption in Beirut, it seems even more likely that developers in other parts of the country would ignore existing legal restrictions. Responsible officials seem to find ways to simply look the other way when cultural heritage is destroyed.
Looting archaeological sites was rampant during the 1975-1990 civil wars, which gave free rein to smugglers looking for statues, jars and mosaics from Lebanon's Phoenician, Roman, Crusader and Byzantine past. "Lebanon is still a popular 'transit country' for such smuggling," said Rana Andari, who manages the archaeological collection at the culture ministry's Directorate General of Antiquities (DGA). "Police bust at least 20 attempted smugglings inside Lebanon annually, and that's not counting what goes on at the airport and border crossings." (Quoted in Moussaoui, 2010). And Matthew Bogdanos, author of Thieves of Baghdad and an expert in the movement of stolen artifacts, believes that Hezbollah is profiting from the illegal antiquities trafficking. “When you consider the routes out of Iraq and on to the rest of the world, therefore via Lebanon, it should come as no surprise that Hezbollah saw this movement as a source of financial gain. We began to see Hezbollah taxing the movement of antiquities. (Bogdanos 2011, also see UNESCO 2011).
From the notorious Allied bombing of the monastery of Monte Cassino in 1944 (Hapgood and Richardson 1984; Parker 2003), through the destruction of archaeological sites in Operations Desert Storm (Gibson 1997) and Iraqi Freedom (Tucker 2009; Bogdanos 2006; CENTCOM Historical/Cultural Advisory Group 2012), the damage done to archaeological sites by military activity is well known. A brief overview sets the stage for observations about sites in the sample group.
Monte Cassino is a rocky hill about 130 kilometers southeast of Rome, Italy, ca. 2 kilometers to the west of the town of Cassino, where St. Benedict of Nursia established the first Benedictine monastery around A.D. 529. On February 15, 1944, 142 B-17 Flying Fortresses from the U.S. 13th Strategic Air Force dropped 253 tons of high explosives on the monastery in the first wave of an attack. A second wave included 47 B-25 Mitchell bombers and 40 B-26 Marauders, which together dropped a further 100 tons. These two waves were followed by artillery bombardment (Parker 2003: 181-182). The reason given for the bombing was that the monastery was being used by the German army as an observation post and artillery emplacement. But the Abbot of the monastery had confirmed beforehand by written message that there were no Germans in the abbey (see Hapgood and Richardson 1984: 203-204), and this justification was subsequently walked back by a string of investigations starting in 1949, and culminating with the U.S. Army’s official history from 1969, which stated that “the abbey was actually unoccupied by German troops” (Hapgood and Richardson 1984:237).
Gibson reported that:
The Gulf War of 1991 has had a devastating impact on the archaeology of Iraq. This statement is true although destruction of sites during the war was relatively slight, as far as can be gauged. Bombs dropped into the ziggurat enclosure area at Ur created large craters, about ten metres in diameter and four metres deep, and one strafing run by a plane resulted in four hundred holes in one side of the ziggurat. Use of Tell al-Lahm, to the southeast of Ur, as a position for US troops was accompanied by machine-excavation of several large holes. Probably other tells suffered similar damage, but lacking a systematic study of the war's effect on antiquities, as requested by UNESCO but denied by the U. N. Security Council, we cannot say for certain.[Gibson 1997]
Although the U.S. military has tried subsequently to avoid destroying archaeological sites, the necessities of war frequently dictate that such places be attacked if they are being used by the enemy and the lives of U.S. soldiers are at stake. Sometimes the fog of war and/or political pressure make an attack almost inevitable, regardless of whether there is any real danger from a place. Hapgood and Richardson (1984) present a detailed account of how these factors influenced the destruction of Monte Cassino. Sometimes, decisions are made by military planners that adversely affect cultural resources, even when the lives of troops are not directly endangered. Tucker (2009) records “The United States military turned the site of ancient Babylon into Camp Alpha in 2003 and 2004, inflicting serious damage according to an exhaustive damage assessment recently released by UNESCO. Bulldozers leveled many of Babylon's artifact-laden hills. Helicopters caused structural damage to an ancient theater.”
In 2011, early reports indicated that NATO had bombed the ancient sites of Leptis Magna and Sabratha (Radyuhin 2011) in Libya. However, “Subsequent inspections indicated that the sites had not been targeted by NATO, though nearby military targets were. The claims circulated across the internet regarding NATO's bombing of Leptis Magna were later shown to be not true. NATO did bomb locations nearby Leptis Magna and Zlitan, but there is no evidence that they bombed Leptis itself. However, it emerged later that the bombing extravaganza nearby did cause some reverberating damage, since the laws of physics dictate that the vibration of blasts travel through the ground way beyond the target's boundaries” (Nesmenser 2011). A small Roman fort occupied a hilltop overlooking Leptis, and it contained a radar station, which was completely destroyed by precision bombing. The fort sustained damage as well (Blue Shield and IMCuRWG 2011:6). “In Sabratha, one of the most important sites in Libya, there had been posts from Army Brigade 219 that occupied the place from early July until the 17th of August. They established several firing positions and observation posts. Some damage from small arms fire on the amphitheatre can be found which is minor. There is also some minor damage from anti aircraft fire.” (Blue Shield and IMCuRWG 2011:7).
Archaeological sites, especially prominent structures such as the Crusader Period Castle of the Sea near Sidon, the Castle of St. Louis in Sidon, the Castle of St. Giles in Tripoli, Tibnin, in southern Lebanon, and Beaufort, high above the Litani River, are frequently used by modern-day militias and armies for precisely the same reasons they were built in the first place. They command expansive views of the countryside around them. For this reason they were originally fortified, and recent combatants in the wars of Lebanon have reoccupied these fortified heights (Fisk 2002: 54). The mounded tell sites of the ancient Near East are also tempting targets for military operations, since they often provide the best viewsheds in their vicinity. From time immemorial, humans have sought the high ground in conflicts, and archaeological sites frequently offer the best topography in a region. As locations for radar installations, sniper nests, forward artillery observation posts, and other operations, sites are often too well situated to ignore, and subsequently come under fire. “The Great Mosque of Samarra, built in the 9th century, was once the largest mosque in the world. Its minaret, the Malwiya Tower, is a dramatic spiraling cone that rises more than 170 feet above the desert. Not only is the tower one of the most recognized buildings in the Middle East, it was featured on Iraq's currency. Despite protests issued by scholars, U.S. snipers occupied the Malwiya Tower as a lookout. In 2005, the top floor of the minaret was blasted by an insurgent bomb” (Tucker 2009).
Other than direct military activity, looting constitutes the most destructive impact on archaeological sites and cultural heritage. Bogdanos (2006) described the looting of the Baghdad Museum after the fall of Baghdad in Operation Iraqi Freedom. Looting continues in Iraq because of the breakdown of civil authority, an indirect cause of the Iraq war (Tucker 2009). "The immediate, near-term and long-term effect of Operation Iraqi Freedom on the cultural heritage of Iraq cannot be overstated. It also, in several respects, is not yet fully known, because ongoing problems such as site looting continues four and one-half years after the invasion, and the long-term effects of military action at Babylon" (CENTCOM Historical/Cultural Advisory Group 2012). It is now occurring in Syria, too (Fisk 2012). These are indirect effects of warfare.
Figure 30. Religious enclaves in modern Lebanon.
Civil strife, warfare, and foreign intervention have been endemic in the Lebanon region for the past two centuries (Table 2). Interspersed with the major conflicts have been a series of political assassinations and vendettas, which have fueled subsequent clashes. The political and social instability in the region contributed to what would later be called the “Lebanese Diaspora” (Shadid 2012: 19). Traboulsi (2007:47) attributes the beginning of the diaspora to the generalization of a monetary economy based almost exclusively on silk production, rather than food crops, and the unavailability of land to peasant farmers. These factors started the first migration in the 1860’s.
The semi-autonomous status of Lebanon was revoked in favor of direct Ottoman rule in 1915. It did not last long. In the infamous Sykes-Picot Agreement of 1916, Britain and France agreed to divide the Arab provinces of the Ottoman Empire outside the Arabian Peninsula amongst themselves following the end of the Great War. Britain took Palestine, Transjordan and Iraq; France claimed Syria. The agreement's principal terms were reaffirmed by the inter-Allied San Remo conference of 19–26 April 1920 and the ratification of the resulting League of Nations mandates by the Council of the League of Nations on 24 July 1922.
| Table 2. Chronology of Major Events Affecting Lebanon Since 18201 | |
| Year(s) | Event |
| 1820-21 | Antilliyas-Lihfid commoner's revolt |
| 1838 | Druze revolt |
| 1840 | Revolt against Bashir and Egyptian rule: military intervention of foreign powers |
| 1841 | Civil strife in Mt. Lebanon |
| 1843 | Mt. Lebanon divided into Christian and Druze regions |
| 1845 | Renewed civil strife in Mt. Lebanon |
| 1858-61 | Kisrawan commoners' revolt |
| 1915 | Direct Ottoman rule over Mt. Lebanon established |
| 1918 | French armies in Lebanon |
| 1916 | Sykes-Picot Agreement divides post-war Ottoman Empire between France and Britain |
| 1920 | San Remo Conference awards mandate for Syria to France, Iraq, Palestine, and Transjordan to Britain |
| 1920 | French troops overthrow Arab rule in Damascus |
| 1920 | Declaration of Greater Lebanon |
| 1925-27 | Druze Revolt |
| 1948-49 | Arab-Israeli War |
| 1958 | Lebanese Civil War |
| 1968 | PLO fighters enter Lebanon |
| 12/28/68 | Israeli Raid on Beirut |
| 1969 | Palestinian-Lebanese Hostility |
| 1969-70 | Christian-Shia Violence: Beirut |
| 1970 | Black September - PLO driven out of Jordan, relocates to Lebanon |
| 1970 | Lebanese-Palestinian Clashes |
| 1971 | Lebanese-Palestinian Violence |
| 1973 | Israeli Raid on Beirut |
| 1973 | Lebanese-Palestinian Clashes |
| 1975-76 | 2nd Lebanese Civil War |
| 1978 | Israeli Invasion of Lebanon |
| 1981 | Israeli Bombing in South Lebanon |
| 1982-1984 | The Israeli Invasion of Lebanon |
| 1984-2000 | The Israeli Occupation of South Lebanon |
| 1993 | Operation Accountability/The Seven-Day War |
| 4/11/96-4/27/96 | Operation Grapes of Wrath |
| 2005 | The Cedar Revolution |
| 2006 | The Israeli-Hezbollah War |
| 5/20/07-9/2/07 | North Lebanon Conflict |
| 5/7/08-5/21/08 | Hezbollah Rebellion |
1Sources: Traboulsi (2007); http://www.historyguy.com/wars_of_lebanon.htm. |
|
By the end of World War I, famine had killed an estimated 100,000 people in Beirut and Mount Lebanon, about 30% of the total population. In the first half of 1920, Lebanese territory was claimed as part of the Arab Kingdom of Syria, which had been declared by Prince Feisal following the capture of Damascus by the Arab army in 1918, but shortly afterwards the Franco-Syrian War resulted in Arab defeat and capitulation of the Hashemites.
On September 1, 1920 France established Greater Lebanon. As an effort to carve out a Christian majority, it was a dismal failure. Greater Lebanon contains a volatile mix of Sunni and Shia, Druze, Melkite, Greek Orthodox and Maronite Christians (Fig 30, above), which has contributed to the political and social instability of the country.
Figure 31. Tell Rachidiyeh in 1970 (left) and 2010 (right).
The mounded site of Tell Rachidiyeh (also spelled Rashidieh) contains Chalcolithic, Early Bronze, Middle Bronze, Iron Age, Roman, and Byzantine occupations, as well as the modern village of Rachidiyeh. The site (fig. 31, A-37, B-73) is about 11.8 ha, with a buffer of 15.8 ha, for a total area of 27.6 ha in our study. The site is on the beach. In 1970, most of the site area was already developed, except for the region in the northwest corner, which was classed as agricultural. The part of the buffer clearly on the beach was classed as unaltered. Development is observed in the 1970 CORONA image in the northwestern part of the site buffer, and another area of development is indicated on the east side of the buffer. Agricultural areas existed in the northeast and south parts of the buffer. By 2010, the entire site, and most of its buffer are developed. The only exception is the area on the south side of the buffer, which is in agriculture.
The presence of the Rashidieh Refugee Camp, located immediately north of the tell site, and clearly visible in the CORONA image above, is most significant for the present discussion. The southern part of the camp extends into the site buffer, right up to the base of the tell itself. “The Rashidieh camp is divided into ‘old’ and ‘new’ sections. The older part was built by the French government in 1936 to accommodate Armenian refugees who fled to Lebanon. The ‘new camp’ was built by UNRWA in 1963 to accommodate Palestine refugees who were evacuated from Gouraud camp in the Baalbek area of Lebanon. Most of the inhabitants of Rashidieh camp originally come from Deir al-Qassi, Alma an-Naher and other villages in northern Palestine” (UNWRA 2012).
The Rashidieh camp has been repeatedly bombed or shelled during the last 35 years. During 1981-1982 the area was being used by Palestinian guerilla fighters to launch Katyusha rockets into Israel, a mere five miles south (Fisk 2002:39). The Israeli response was unrelenting. "The bombing of refugee camps in Lebanon continued and continues to the present day. Its intensity may be judged by the fact that one of those camps, the Rashidieh refugee camp near Tyre, was shelled or bombed 500 times between 1977 and 1982. Finally, it was razed to the ground in 1982 during the Israeli invasion” (Cattan 1988: 126). According to the UNWRA (2012a), “Nearly 600 shelters were totally or partially destroyed and more than 5,000 refugees were displaced.” Fisk (2002:36) reports that the camp was enduring Israeli shellfire or bombing “almost every day.” The camp was also shelled by the Amal (a local Shiite militia) during their 1984-1989 “War of the Camps” fought against the PLO and its splinter groups (Traboulsi 2012: Chapter 13; Deeb 2004: 129; Anonymous 1986).
Figure 32. Map of Israeli air strikes during the 2006 war (Lambeth 2011: fig. 3.7).
The camp was rebuilt. The 1,200 Palestinians reported killed (Fisk 2002: 255) in the area around Tyre (mostly in the refugee camps) were buried. Israel, however, was unable to defeat the PLO and, increasingly, Hizbollah, the Syrian/Iranian-backed militia that emerged in the Shiite enclaves of eastern and southern Lebanon, took up the fight. “Hizbollah in particular, were determined to force the Israelis to withdraw beyond the border, and consequently, what had started as a trans-border conflict, became an extended conflict on Lebanese soil” (Najem 2000: 4007). In 2000, the IDF withdrew from Lebanon, leaving the field to Hizbollah, which subsequently rearmed and stepped up its attacks.
Hezbollah, the indigenous Shia militia that arose with Iranian sponsorship, received its baptism of fire on the beaches of Khalde even as the PLO and the Syrians were defeated in 1982 (Fisk 2002: 227). Following the withdrawal of the IDF from southern Lebanon in 2000, this new militia began a series of rocket attacks on the towns of northern Israel. By 2006, the Israeli government had had enough, and the next round was fought with this new opponent.
From July 12 until August 14, 2006, the IDF waged a 34-day campaign in Lebanon against the radical Islamist terrorist organization Hezbollah in response to a surprise incursion by Hezbollah combatants into northern Israel and the abduction of two Israeli soldiers in a well-planned provocation aimed at forcing the release of Islamist terrorist held by Israel. That campaign, code-named Operation Change of Direction, included the most complex air offensive to have taken place in the IAF’s nearly 60-year history [Lambeth 2011: xiii].
The area around the Rashidieh camp was again under fire. "The Tyre area was the target of sustained Israeli bombardment from the beginning of the conflict but the camps themselves were not directly targeted. However, the bombing and shelling on many occasions was in the immediate vicinity of the camps and for several hours at a time" (UNWRA 2006a). "The southern edges of Rashidieh camp and the area around Boruj Shemali were targeted yesterday." (UNWRA 2006b: 6). As noted above, the southern edges of the Rashidieh camp are on the slopes of Tell Rachidiyeh.
“As for the campaign’s final tally sheet, the IAF flew a total of 18,900 combat sorties and struck some 7,000 targets at an average rate of 340 per day.” (Lambeth 2011: xviii). Figure 32 illustrates the locations of the IAF air strikes.
The process of digitizing land classifications on the 2010 imagery revealed a number of features that appeared to be military in origin. However, since these images were several years past the dates of the last intensive warfare in the region, it was deemed necessary to compare these with images acquired just before 2006. The map of the IAF bombing campaign suggested that a number of the sites in our study may have been affected, directly or indirectly. In order to pinpoint locations from the IAF bombing campaign that might have affected archaeological sites in our sample, a large-scale, online version of the RAND map shown in figure 32 was downloaded and geo-referenced in Global Mapper. Using it as a background, we plotted our site distribution on it. In figure 33, tell sites in this study are marked as yellow X’s. Here we discuss several sites that are in close proximity to IAF airstrikes. Since the Beqa’a Valley was also the scene of fighting in the 1982 ware, some of our discussion includes features that may be relicts of that earlier conflict.
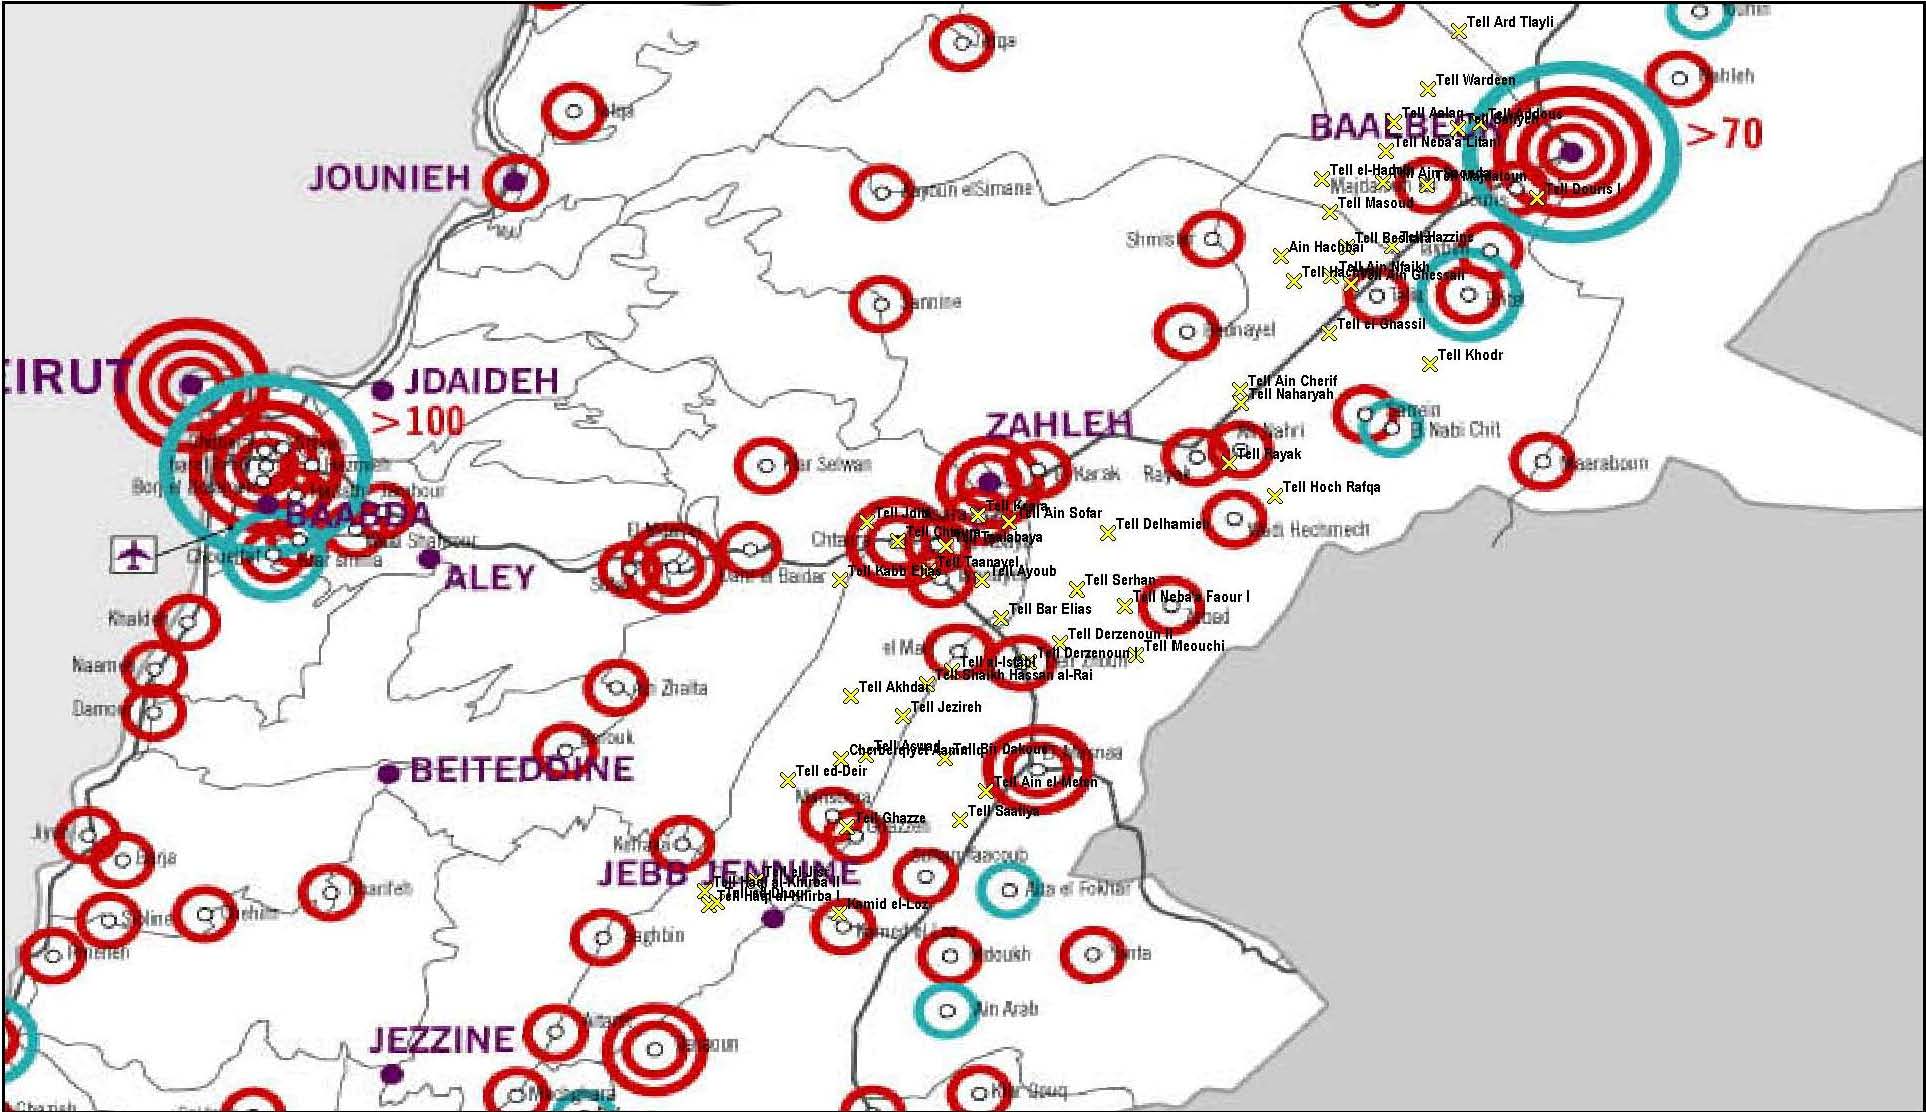
Figure 33. Archaeological tell sites in the Beqa’a Valley affected by IAF bombing campaign in 2006.
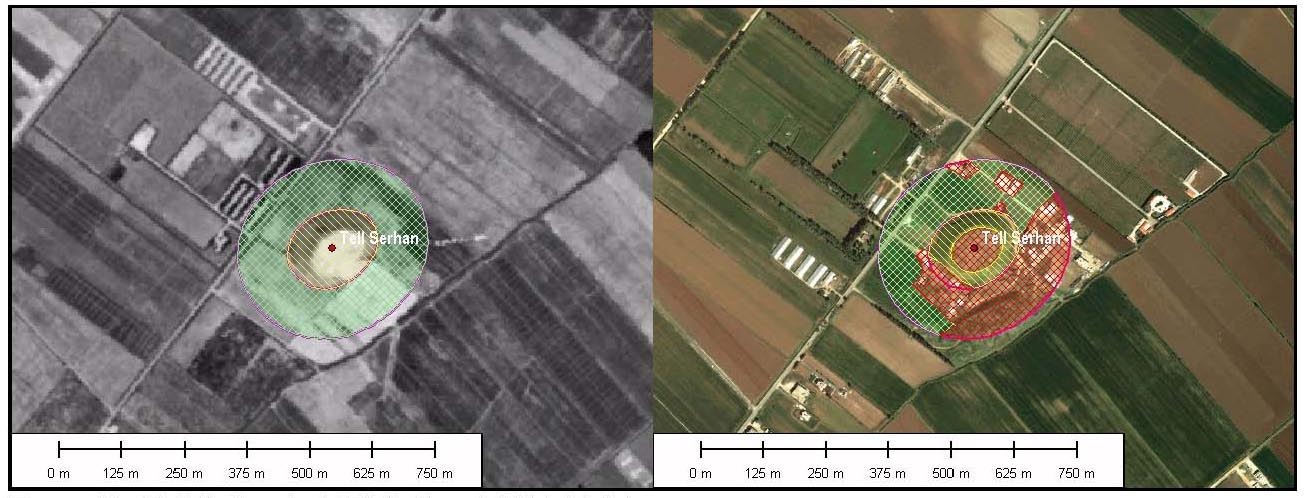
Figure 33. Tell Serhan in 1970 (left) and 2010 (right).
A relatively small (2.18 ha, 8.445 ha buffer, total 10.625 ha) site located southeast of Zahle and southwest of Rayak in the Beqa’a Valley, Tell Serhan (fig. 34, A-40, B-78) has documented archaeological materials dating from the Late Chalcolithic, EB I, EB II, EB III, EB IV / MB I / Int. Bronze, MB IIb/c, LB I, LB II, Iron I, Iron II, Persian (Iron III), Hellenistic, Roman, and Byzantine Periods. It is a well-formed tell site that appears unaltered in 1970 CORONA imagery, and surrounded by agriculture.
In a November 2005 image from Google Earth (fig. 35), the entire top of the site, and the SE part of the buffer, are covered with earthen revetments for military vehicles. There is also evidence for an earthen berm around the top of the site, and it appears to have foxholes in it.
Google Earth imagery from December, 2004 is of much lower resolution, but it appears that at least some of the revetments are already in place. Large scale features of this type are frequently used to offer protection for the lower parts of armored vehicles, especially tanks (fig. 36). They are usually dug with a bulldozer, and are clearly quite destructive of the underlying archaeological deposits. If they are attacked, the impact of high explosives to the site would be devastating.
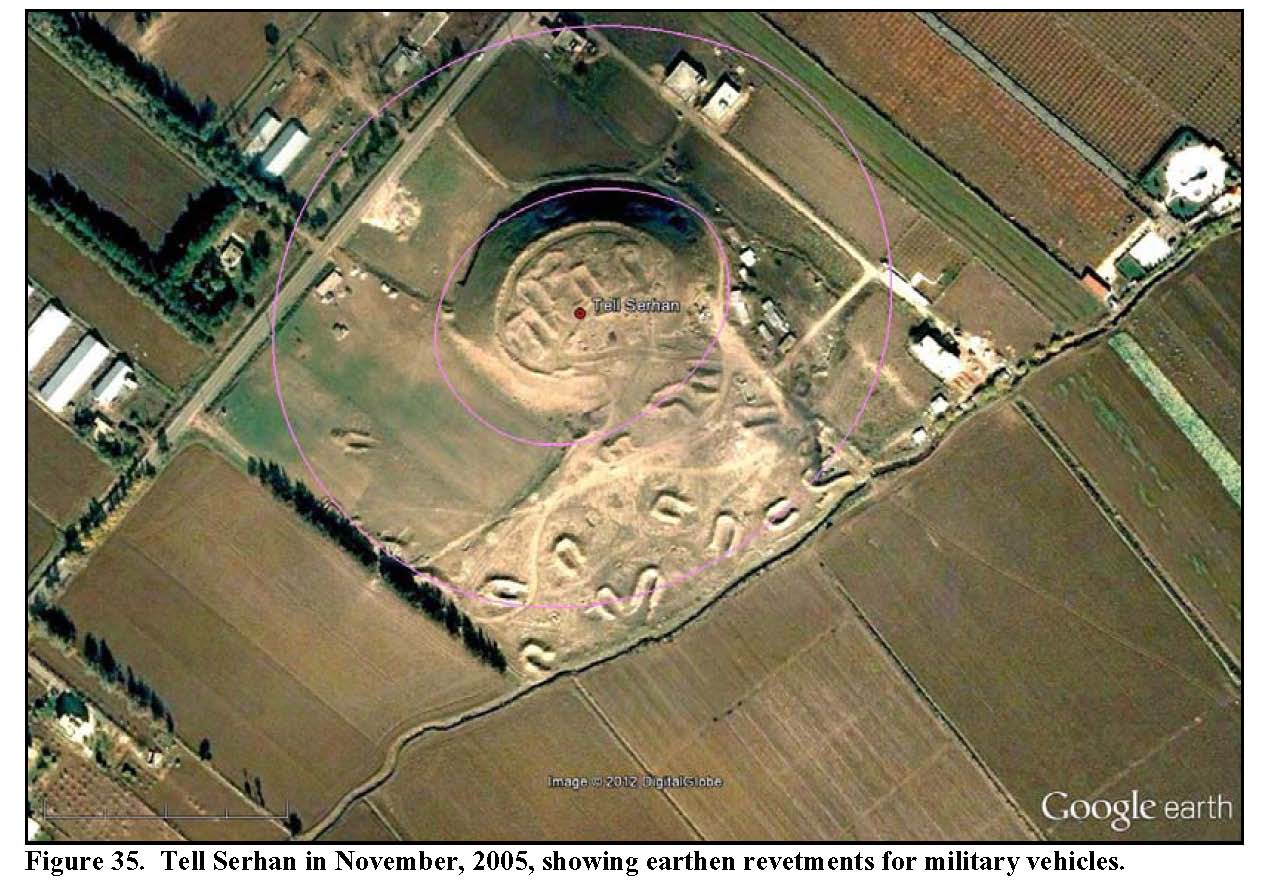
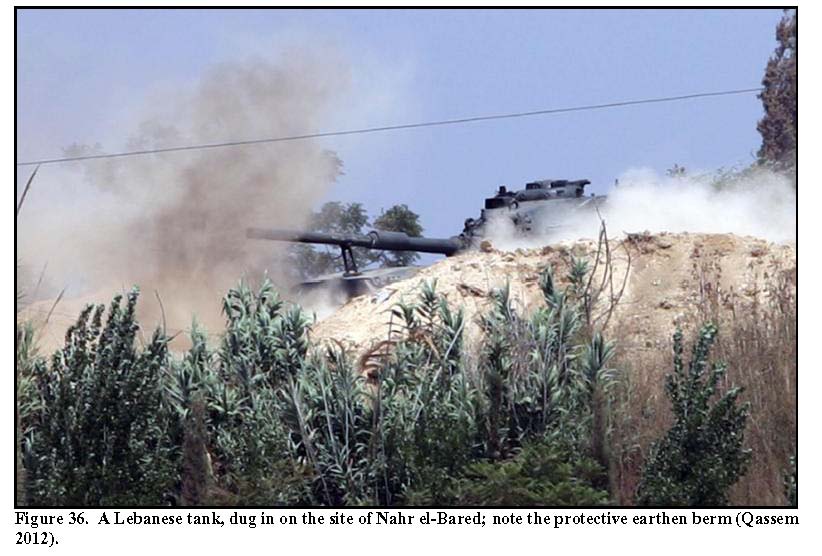
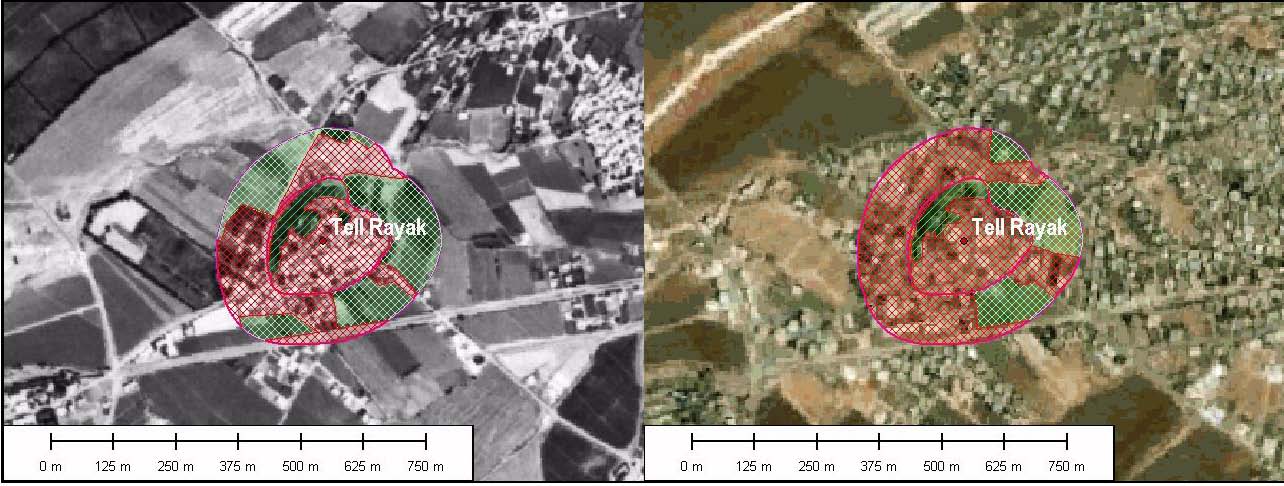
Figure 37. Tell Rayak in 1970 (left) and 2010 (right).
This is a relatively small site (4.127 ha) with a buffer of 10.724 ha, for a total area of 14.851 ha in our study. The site (fig. 37, A-38, B-75) has evidence of occupation dating from the Pottery Neolithic A/Yarmoukian, Pottery Neolithic B, EB I, EB II, EB III, MB, Iron I, Hellenistic, Middle Islamic, Late Islamic, Ottoman Periods. In 1970, most of the site was already developed, with the exception of a small area of vegetation on the northwest slope. There were also large regions of development in the buffer, but the rest wais agriculture. By 2010, there was more development and less agriculture in the buffer, but the site itself appears much the same. A small area at the one o’clock position in the buffer, which was designated as developed in 1970, appears to have reverted to agriculture in 2010. This is an unusual occurrence, and may indicate that circa 1970 buildings have been abandoned, and the area taken over for a garden. Alternatively, it may indicate the presence of a grape arbor near standing structures—a typical urban feature in Near Eastern developments.
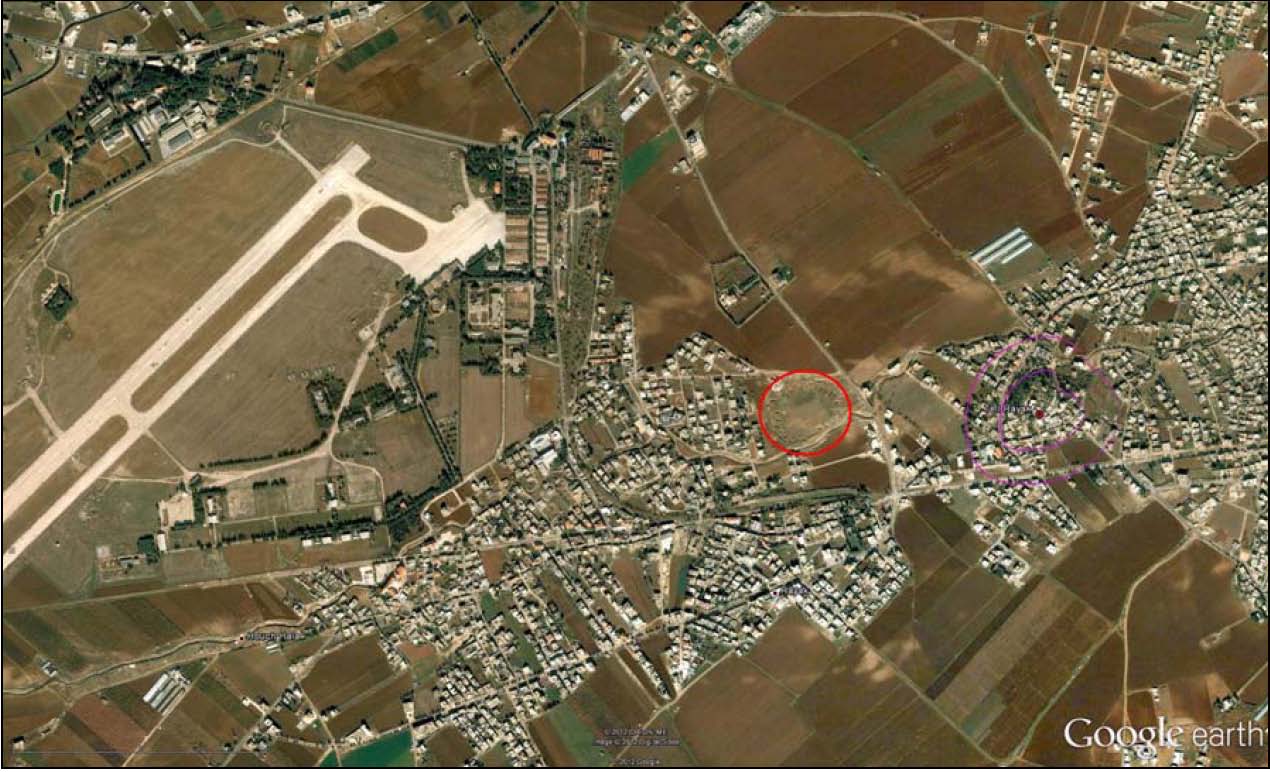
Figure 38. The region to the west of Tell Rayak in 2005, showing the Rayak Air Base.
The area in the red circle is an air-defense installation.
The Syrian Army had taken over the Beqa’a Valley in 1976, including the Rayak Air Base, which is located about 2.5 km west of Tell Rayak (fig. 38). The Rayak Air Base was originally constructed and used by the Germans in World War I, and has been used since 1914 by different foreign armies including the Germans, Ottomans, British, French, and Syrians.
Between the air base and Tell Rayak we see another set of earthworks that appears to be military in origin. Google Earth imagery from November 2005 shows this area, about 700m west of the site, which appears to contain a series of unoccupied emplacements for heavy armored vehicles or a SAM installation (fig. 39). In 1976, Lebanese Hawker Hunter (F-6) jets were appropriated by the Syrian Air Force, and used to support Syrian political ends in Beirut, which, at the time, were intended to bolster the Christian Maronite minority ruler and its Phalangist militia (Fisk 2002: 86). By 1982, however, the Syrians were fighting the Phalangists and their Israeli supporters. Israel attacked Syrian helicopters in the Beqa’a Valley in April, and shot two of them down near Rayak. The Syrians responded by bringing in SAM-6 missile batteries, installing them “in fields just east of the Rayak-Masnaa Road…another battery was dug into earthworks south-west of Chtaura” (Fisk 2002: 191). They had troops billeted at the Rayak Air Base. The SAM-6 missile batteries, though obsolete at the time, still denied IAF access to the Beqa’a Valley for a while, but on June 9, 1982, the IAF staged air strikes “against every Syrian SAM-6 missile battery between Mount Lebanon and the Anti-Lebanon mountains” (Fisk 2002: 221; also see Grant 2002).
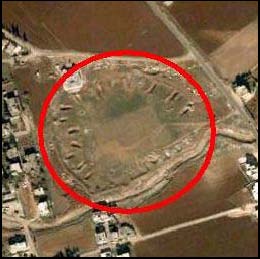
Figure 39. Close-up of the area west
of Tell Rayak in 2005.
Like the rest of Lebanon's airports, the runways at Rayak were bombed by the Israeli Air Force on July 13, during the 2006 Lebanon War. A bomb on each runway was sufficient to punch deep holes and render the airport disabled. By 2012, the features from the 2005 image had been filled in, and buildings were starting to encroach on the spot, but not configured in a manner that would suggest the observed excavations were foundations or basements.
Figure 40. Tell Chtaura in 1970 (left) and 2010 (right).
A relatively small site (3.464 ha, 9.739 ha buffer; total 13.203 ha), Tell Chtaura (fig. 40, A-18, B-35) has been reported to have occupational evidence from the Late Chalcolithic, EB I, EB II, EB III, MB IIb/c, LB I, LB II, Iron I, Iron II, Hellenistic, Roman, Byzantine, Middle Islamic, Late Islamic, and Ottoman periods. It is located in the southwestern part of the Beqa’a Valley, southwest of Zahle. A bit more than half the site and its buffer were developed before 1970, and the rest was in agriculture. By 1997-2003, the Landsat image shows light squares in the NW part of the buffer, which are present as well in the 2001 ASTER image, and clearly identified as development in the 2010 Google Earth image. Some areas that appear as developed on the site in 1970 appear to be in agriculture in the 2010 image. As Fisk reported, the Syrians dug SAM-6 missile batteries “into earthworks south-west of Chtaura” (Fisk 2002: 191). The whole system is easily seen on Google Earth imagery from November, 2005 (fig. 41). It was less than 2 km from the site.
The area in the red circle in figure 41 is a classic example of a Soviet-style SAM-6 missile battery configuration (fig. 42; O’Connor 2002), which is not surprising since the Syrian Army was supplied and trained by the Soviets, and continues to be closely aligned to Russia. A close-up of the southwest corner of figure 41 shows the remains of the missile battery (fig. 43). A group of loose polygonal pattern, with a central control locus (red circle); there are also numerous revetments for heavy armored vehicles (yellow circles). As noted above, on June 9, 1982, the IAF destroyed the battery (Fisk 2002: 221; also see Grant 2002).
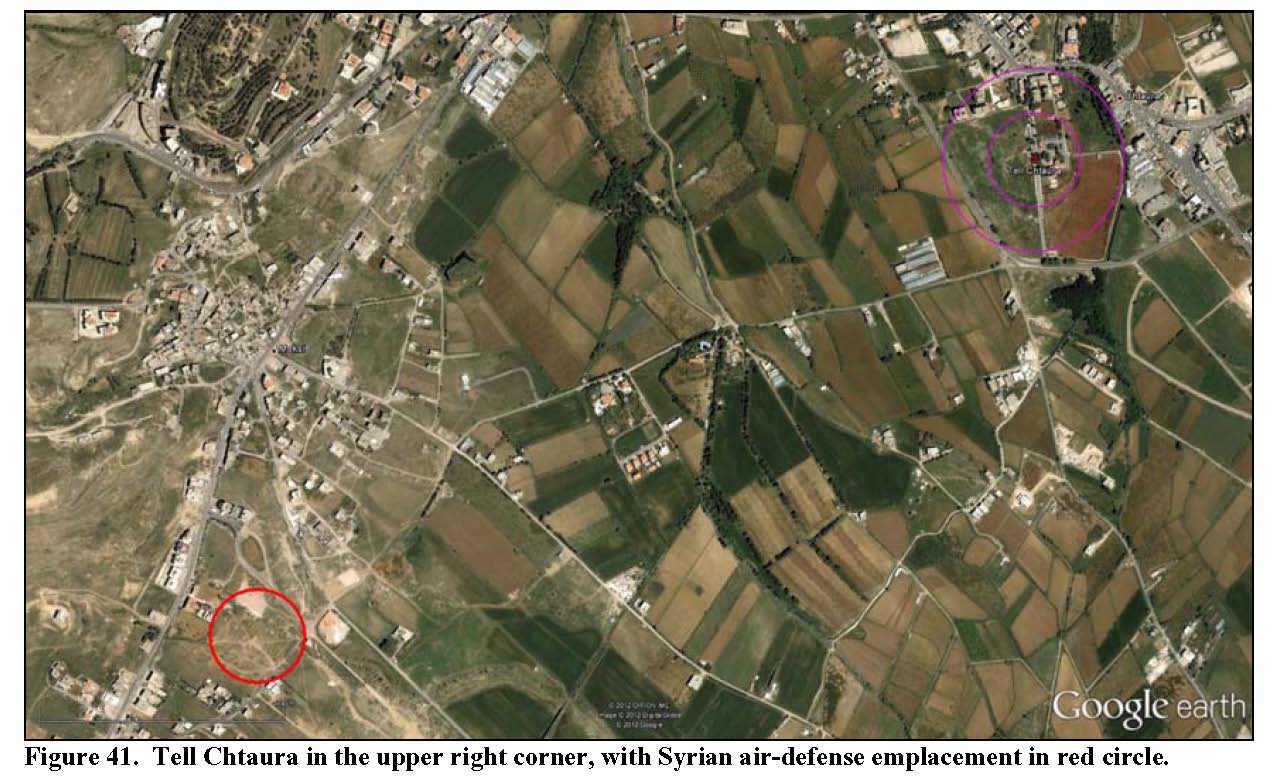
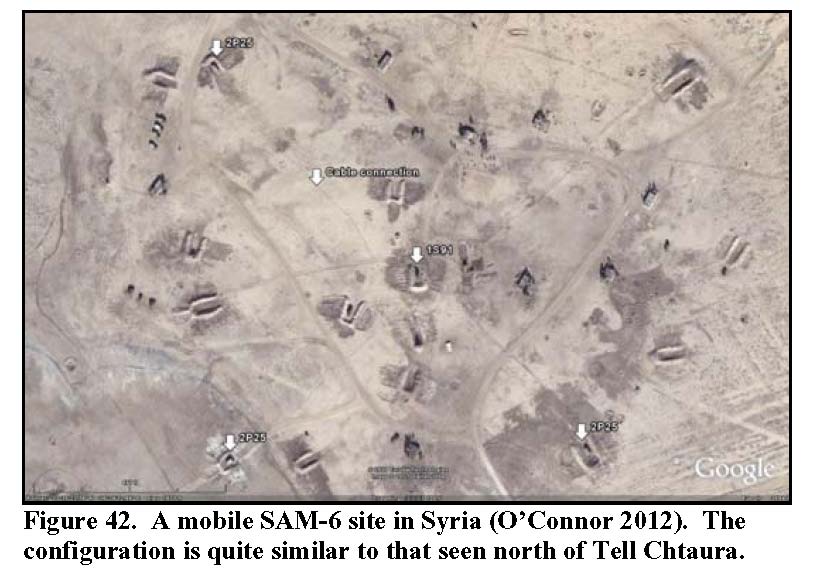
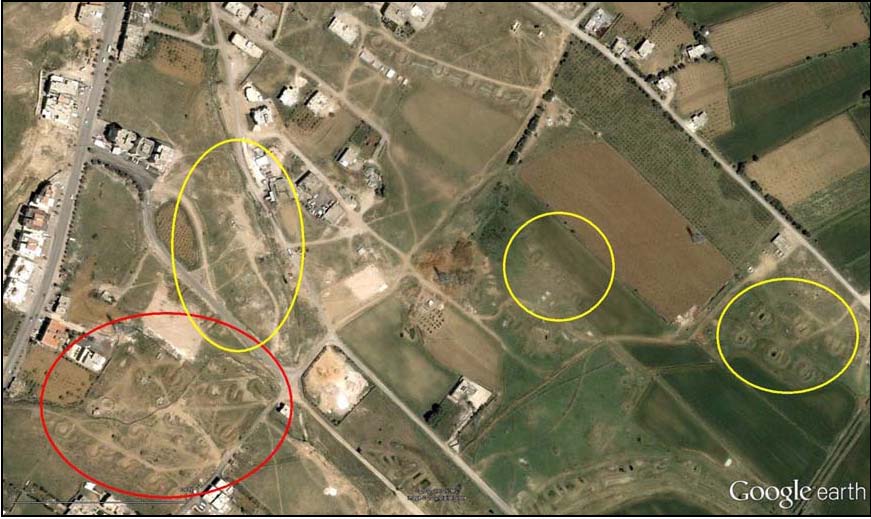
Figure 43. Close-up of the area southwest of Tell Chtaura, showing SAM
emplacement in red circle, and armored vehicle revetments in yellow circles.
The SAM site and its protective revetments for armor are actually located more than 500m closer to Tell Kabb Elias (about 1.5 km vs. 1.9 km), and almost equidistant (2.2 km) from Tell Jdita (fig. 44). Thus, it is just as likely that IAF air strikes could have damaged these other two tells when they struck the air defense site, as it is that Tell Chtaura was damaged. We have discussed it in the context of Tell Chtaura because of Fisk’s description.
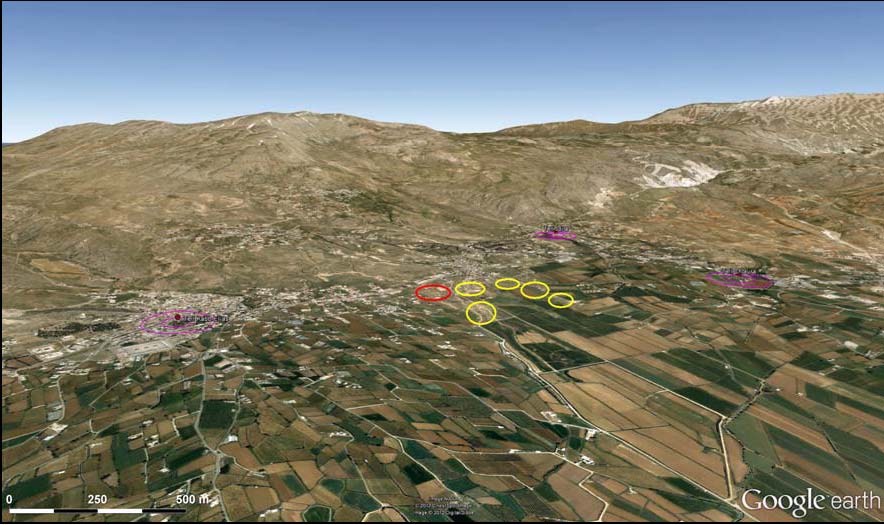
Figure 44. Oblique view of Tell Kabb Elias (left), Tell Chtaura (right)
and Tell Jdita (back center), with SAM-6 air defense site
in red and armored vehicle revetments in yellow.
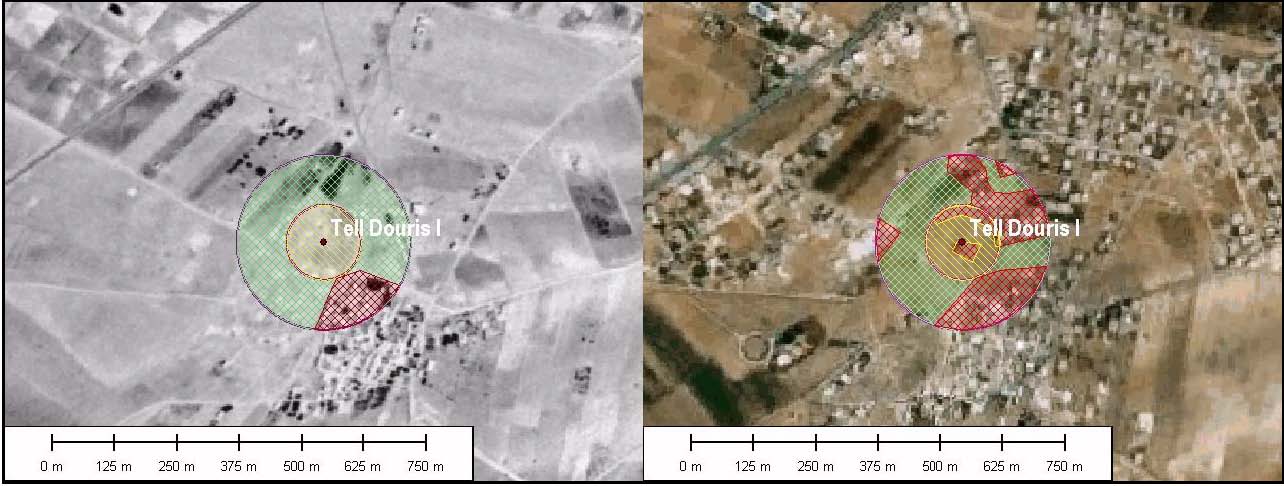
Figure 45. Tell Douris I in 1970 (left) and 2010 (right).
This is a small tell (ca. 9.6 ha for the site and buffer combined) located southwest of Baalbek, one of the major cities in the Beqa’a Valley, and one of the primary targets of the 2006 IAF bombing campaign. Tell Douris I (fig. 45, A-21, B-40) has occupations dating to the Late Chalcolithic, EB I, EB II, EB III, MB IIa, MB IIb/c, Iron I, Iron II, Middle Islamic, Late Islamic, and Ottoman periods. The site is located next to a settlement but appears in CORONA to be mostly unaltered, while the buffer is a mixture of development and agriculture. We classed the whole site as unaltered and most of the buffer as agriculture except for settlement in south side. There is more development in the buffer and on the site by 2010.
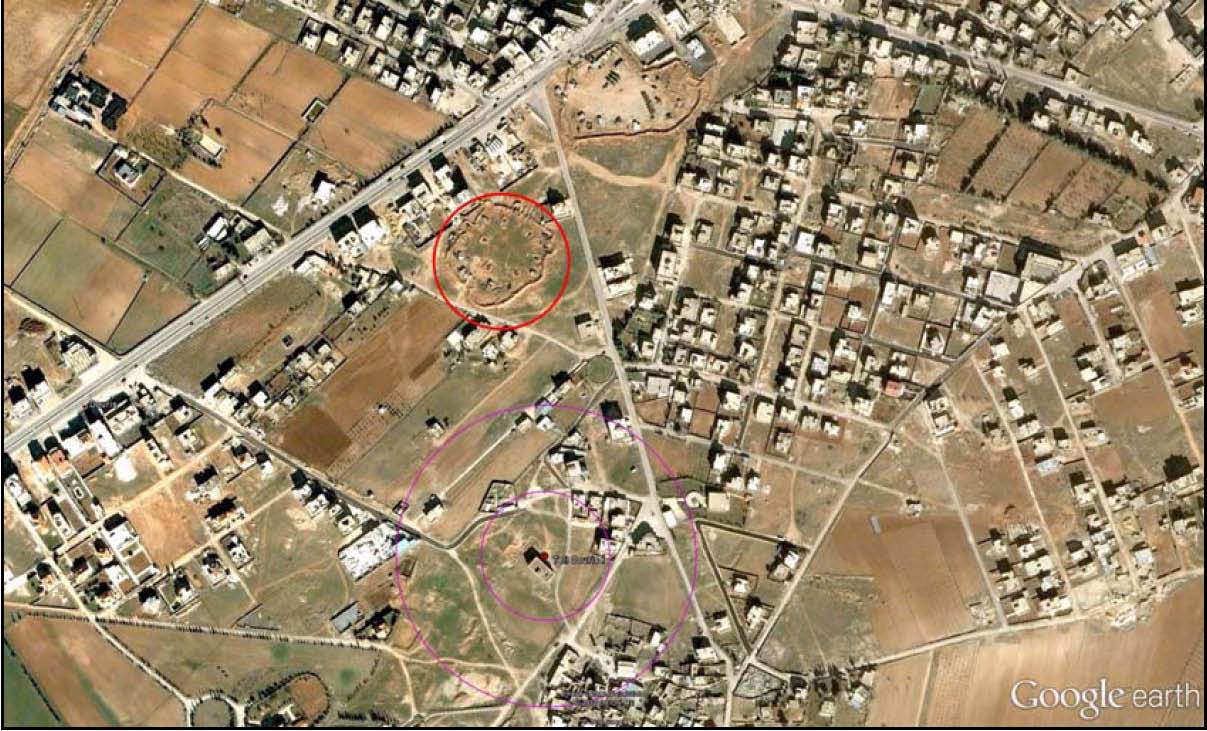
Figure 46. Tell Douris I in 2003, showing air defense configuration north of the site.
In 2003 Google Earth imagery what appears to be an artillery or air defense emplacement can be seen less than 400 meters north of the site (figs. 46 and 47). In the image shown here, the likely air defense site is circled in red. Six features are dug into the earth in a hexagonal pattern, behind an encircling earth embankment. This is another example of a classic Soviet-style air defense arrangement, which was probably struck in 1982 along with the others Fisk noted (2002: 119).
Douris was bombed by the IAF in July-August 2006. In 2012 imagery the embankment is gone, as is any evidence of the hexagonal emplacement; buildings are now being erected on the site, but not in a configuration that matches what could be seen in 2003. Clearly, these features were not basements or excavations for future buildings. We are also suspicious of the area immediately northeast of the circled region (fig. 46); it, too, is behind an embankment and contains a number of heavy vehicles. It may also be military in origin, and is also missing from 2012 imagery.
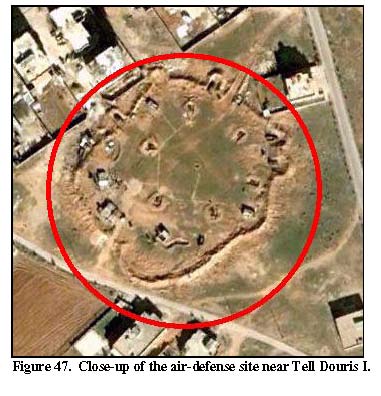
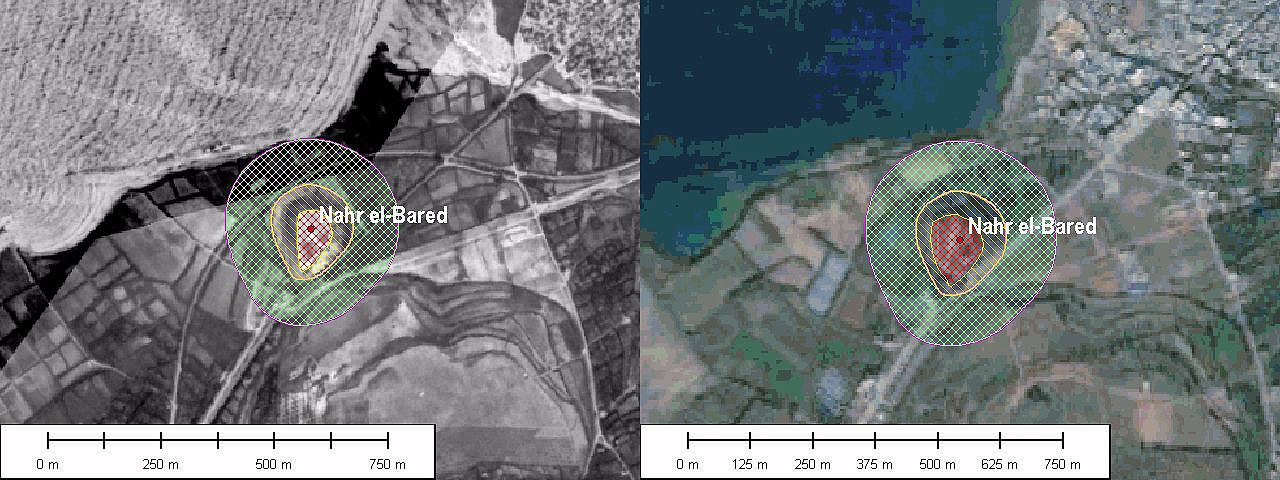
Figure 48. Nahr el-Bared in 1970 (left) and 2010 (right). The refugee camp can be seen in the upper right.
An Early Bronze Age site located on the northern coast of Lebanon, Nahr el-Bared (fig. 48, A-6, B-10) is a mound of approximately 2.8ha in extent, with a buffer of 9.2ha, totaling about 12ha. There is development on the upper surface of the site by 1970, but it is not mainly structures. Instead it appears to be a military installation, possibly slit trenches. The slopes of the site were unaltered in 1970, and remain so in 2010. Google shows a number of structures later. All other land appears to be agricultural.
The Nahr el Bared refugee camp is 16km north of Tripoli near the coastal road in north Lebanon, and less than 500m northeast of the site (fig. 49). The camp was established by the League of Red Cross Societies in 1949 to accommodate Palestine refugees from the Lake Huleh area of northern Palestine (UNRWA 2012b).
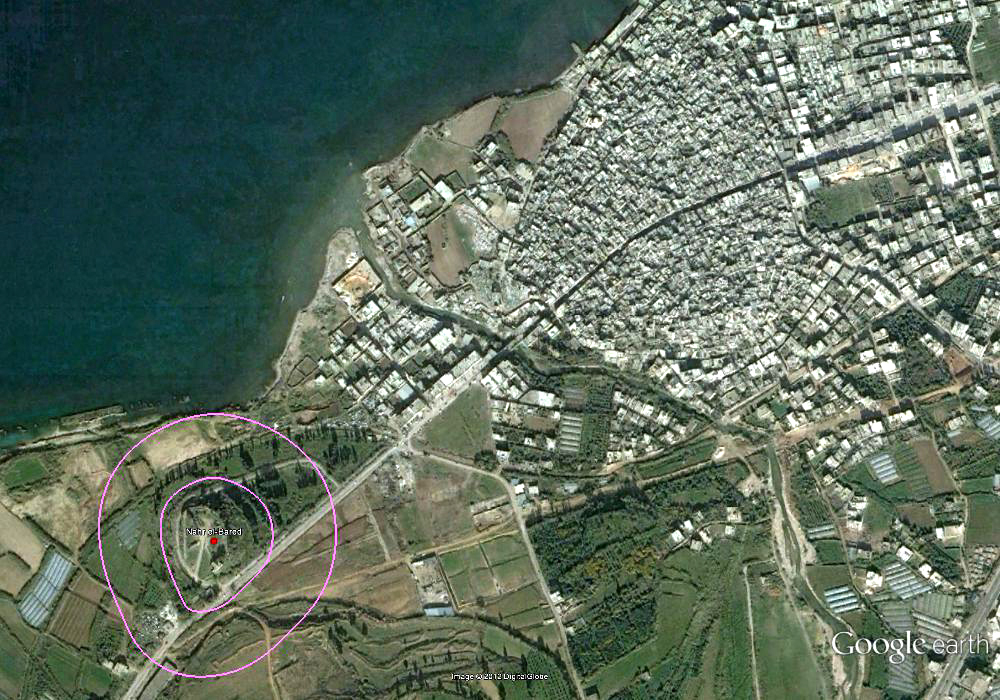
Figure 49. The site of Nahr el-Bared and the refugee camp in 2005.
In 2007, the Lebanese Army attacked fighters of the extremist group Fatah Al-Islam, which had established itself in the camp. In early June of that year, the BBC reported that "The Lebanese army is trying to dislodge Fatah al-Islammilitants who have been besieged in the Nahr al-Bared Palestinian refugee camp for 13 days. Aid agencies say they are worried for the safety of civilians as artillery fire has been pounding the camp. The fighting has been concentrated on the edges of the camp near the southern and northern entrances. Dozens of army tanks and armoured vehicles have moved up to the edge of the camp. Artillery and mortar fire has been hitting the camp and the army says it has seized several Fatah al-Islam positions" (BBC News 2007).
By mid-July, the Lebanese Army had broken into the camp. On July 15, 2007, "Soldiers exchanged automatic rifle fire and grenades with militants at building and alleyways leading to the centre of Nahr al-Bared while army artillery and tanks pounded other areas. Fatah al-Islam fighters hit back, firing a dozen Katyusha rockets at surrounding Lebanese villages. ...The military has increased its bombardment of the besieged camp since Thursday, anxious not to get sucked into a war of attrition with the well-trained and well-armed militants" (Siddiq 2007). Nonetheless, a war of attrition did develop, until finally, “An estimated 95 per cent of all buildings and infrastructure were either destroyed or damaged beyond repair” (UNRWA 2012b).
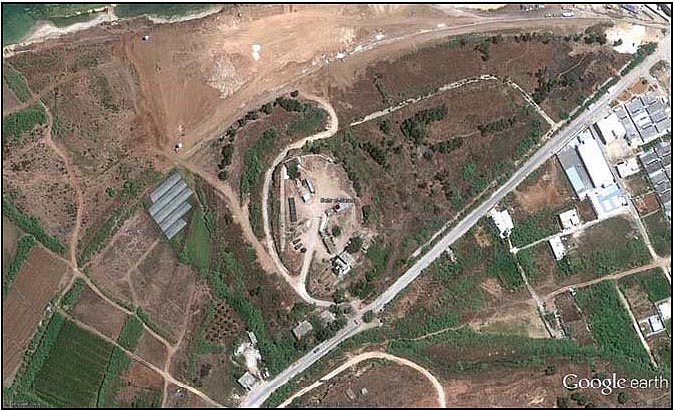
Figure 50. Nahr el-Bared in 2007, showing military vehicles on top of the site.
This image, retreived from Google Earth in July, 2012, is no longer available
in the Google Earth "historical imagery".
The site of Nahr el-Bared is less than ½ kilometer from the southern edge of the camp, where the BBC reported some of the heaviest fighting. In figure 49, above, the camp is clearly visible as the area of very small structures northeast of the site. Not only is the site in close proximity to the battle, but the military position, which appears to have been established on top of the site prior to 1970, was undoubtedly put there to observe the camp (fig. 50 -- Note: this image has been removed from Google Earth since July, 2012.). It is almost inconceivable that the site was not used as a forward observation post for the artillery bombardment that rained destruction on the camp. Indeed, 2007 Google Earth imagery shows a number of military vehicles, including a possible tank (at the 11 o’clock position in fig. 50) on top of the site. This may be the tank shown earlier in figure 36.
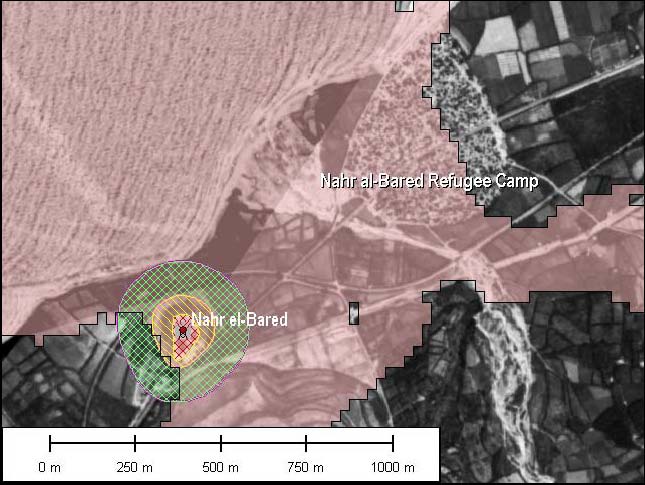
Figure 51. View shed analysis of the Nahr el-Bared region.
Using ASTER DEMs, overlaid with CORONA imagery, we conducted a viewshed analysis of the site and its surrounding area. The results indicate that the top of the tell offers the best view of the camp. In figure 51 all the shaded pink region is visible from the top of the site. In contrast, though the hill south of the site appears to offer an equally advantageous view of the camp, it in fact does not compare with the site itself. The site was clearly used by the Lebanese Army as an artillery observation point. The site could have suffered irreparable damage had Fatah al-Islam chosen to bombard the site, rather than “…firing a dozen Katyusha rockets at surrounding Lebanese villages” (Siddiq 2007).
The examples discussed here document potential damage to archaeological sites or their vicinities by shelling, aerial bombardment, or use of sites for military purposes from before the CORONA imagers were acquired in 1970 through the last major episode of fighting in Lebanon between the Lebanese Army and Fatah al-Islam in 2006. Many more of the sites in our sample may have been affected by the long series of wars in Lebanon, but we limited this discussion to only those places where there was clear evidence of military activity on a site, or in its immediate vicinity. The map of IAF strikes in the 2006 war with Hezbollah, on which we overlaid our site distribution, formed the basis of the discussion for several sites that were clearly within the areas affected by bombardment. For the sake of brevity in this report, we have not pursued an examination of other sites in the sample that are near air strikes. But the distribution clearly indicates that other sites were endangered.
Sites do not have to be hit by direct fire or bombardment to be damaged by warfare. Explosions create pressure waves that can damage buildings, and these can propagate through the ground as well as the air, so that buried archaeological strata and features can be damaged. This kind of destruction would not necessarily be visible, except from close observation on the ground and/or through excavation. The shockwaves from bombardment can produce localized damage that is similar to the destruction wrought by earthquakes. So any archaeological site in the vicinity of an artillery or aerial attack is vulnerable, whether it’s directly attacked or not. The proximity of a site to a military target is sufficient to endanger it, especially given Robert Fisk’s observation that the IAF had a penchant “for destroying everything in a quarter-mile vicinity of a target” (2002:191).
Since our site sample included only those places with Early or Middle Bronze Age occupations, it does not represent the full population of tell sites in Lebanon. Many other sites, without EB or MB occupations, exist in the regions heavily bombarded by the IAF, especially in southern Lebanon and the Beqa’a Valley. Clearly, this is a subject that deserves greater scrutiny.
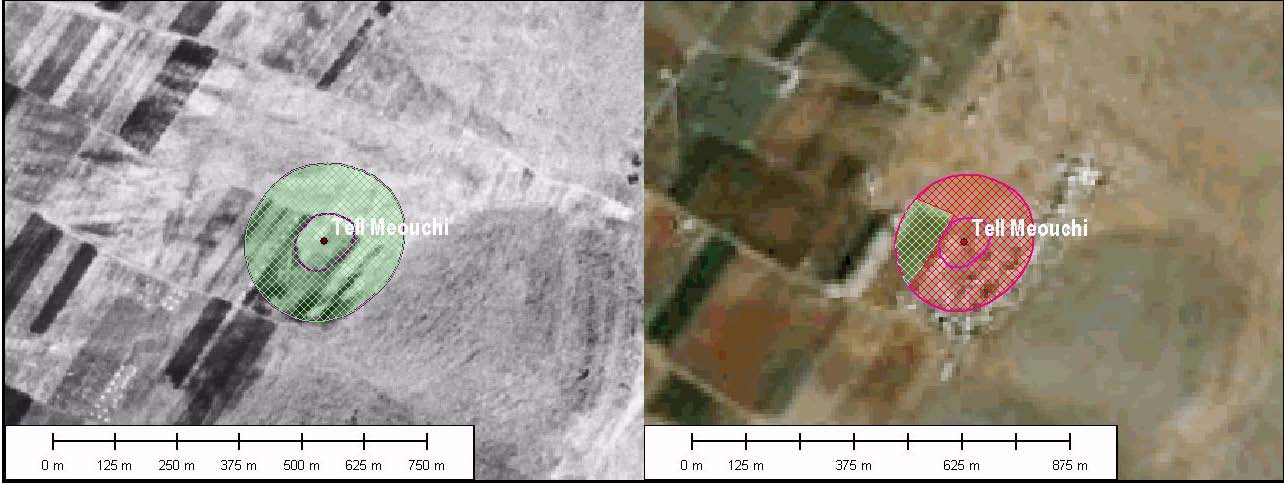
Figure 52. Tell Meouchi in 1970 (left) and 2010 (right).
Tell Meouchi (fig. 52, A-35, B-68) is a small site (1.008 ha, 6.772 ha buffer, 7.78 ha total), with occupations dating from the Late Chalcolithic, EB I, EB II, EB III, MB IIb/c, and Middle Islamic periods. The site is located in the southeastern Beqa’a Valley. In 1970 all of the site and buffer was classed as agriculture. By 2010, everything has been developed except for one patch of agriculture on the west side of the buffer. This represents a decrease in agricultural land from 100% to 17.7% (z = -4.582, p = < .001), and an increase in development from 0% to 82.2% (z = 4.342, p = < .001) of the site and buffer combined in the 40 years covered by our imagery. Development has also begun to spread outside the site buffer on the south and east sides.
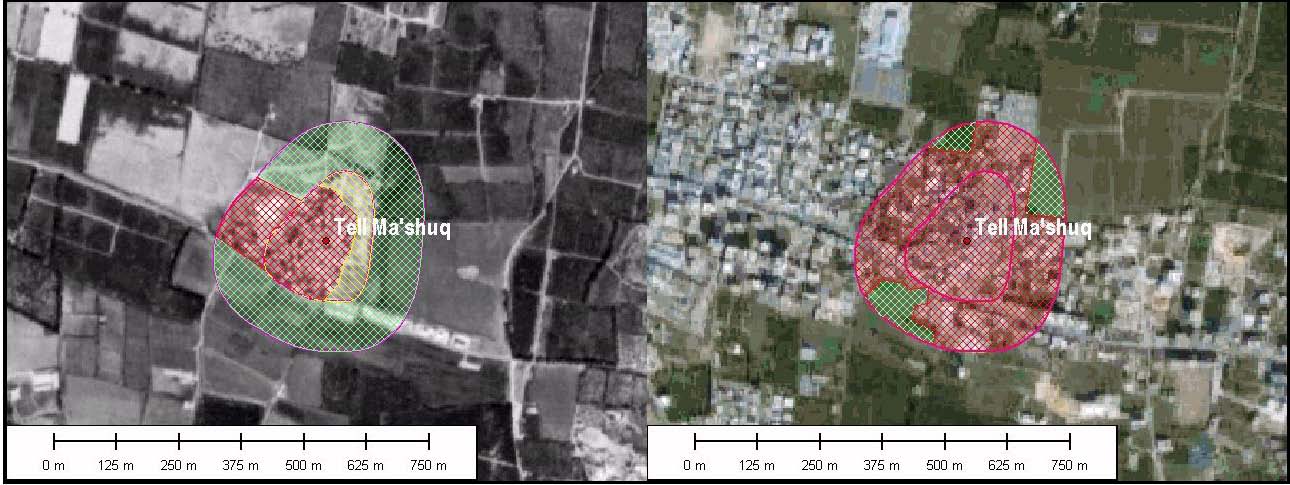
Figure 53. Tell Ma’shuq in 1970 (left) and 2010 (right).
An Early Bronze Age, Persian (Iron III), Hellenistic, Roman, Byzantine, and Islamic site located east of the peninsula of Tyre, Tell Ma’shuq (fig. 53, A-34, B-66) comprises a site of about 4.194 ha, with a surrounding buffer of 10.796 ha, for a total of 14.991 ha. Given the number of air strikes in the vicinity of Tyre during the 2006 IAF air campaign against Hezbollah (Lambeth 2011, see below), it is likely that some damage occurred to the site. Due to its proximity to Tyre, the site was already mostly developed in 1970, except for the eastern side, and the developed area extended into the buffer on the west side. The rest of the buffer was agricultural in 1970. But by 2010, development has spread from central Tyre eastward along the road that runs past the base of the site, and has engulfed the site. The entire tell and buffer have been developed, save for three small areas of agriculture in the buffer. Overall, this represents an increase from 29.6% in 1970 to 86.1% (z = 2.774, p = 0.0028) in 2010, and a decrease in agricultural land from 61.2% in 1970 to 13.8 % (z = -2.48, p = 0.0066) in 2010. It seems clear that development will spread north and south of the main road, at the expense of agricultural land use.
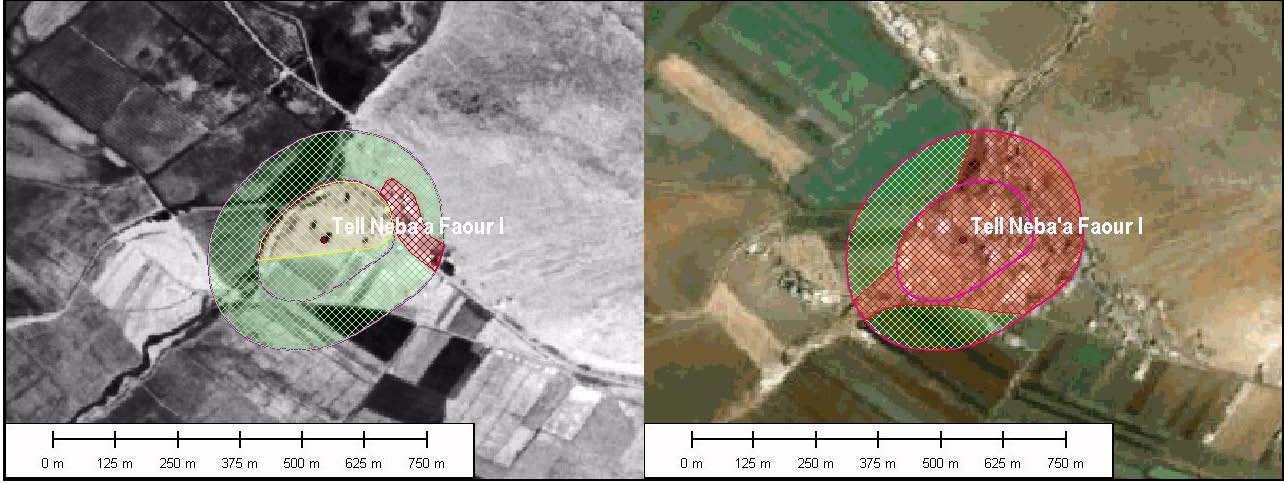
Figure 54. Tell Neba’a Faour I in 1970 (left) and 2010 (right).
Located in the more populated southeastern Beqa’a Valley, south of Zahle and Rayak, Tell Neba’a Faour I (fig. 54, A-36, B-70) is a site of 4.68 ha, with a buffer of 11,134 ha, for a total area examined of 15.814 ha. The site has evidence of occupation during the Epipaleolithic, Neolithic, Pottery Neolithic B, Chalcolithic, Late Chalcolithic, EB I, EB II, EB III, MB IIb/c, Iron I, Hellenistic, and Roman Periods. It appears to have escaped damage during the IAF bombing of the vicinity during 2006. In 1970, half of site appears to have been under cultivation, and the rest appears unaltered. The buffer was mostly agriculture with some development. In 2010, the whole site has been developed. Two portions of the buffer are still agriculture, but the rest is development. This represents an increase in development from 6.3% in 1970 to 66.9% (z = 3.023, p = .0013) in 2010 and a decrease in agriculture from 75% in 1970 to 32.9% (z = -2.162, p = .0153) in 2010. A significant portion of the observed recent development occurs here at the expense of unaltered land, which, in 1970, comprised 18.8% of the site and buffer combined, but was entirely absent in 2010 (z = -1.893, p = .0292). Development has also begun on the hill immediately west of the site, and it seems clear that the trend will further reduce the amount of land under agriculture in the near future.
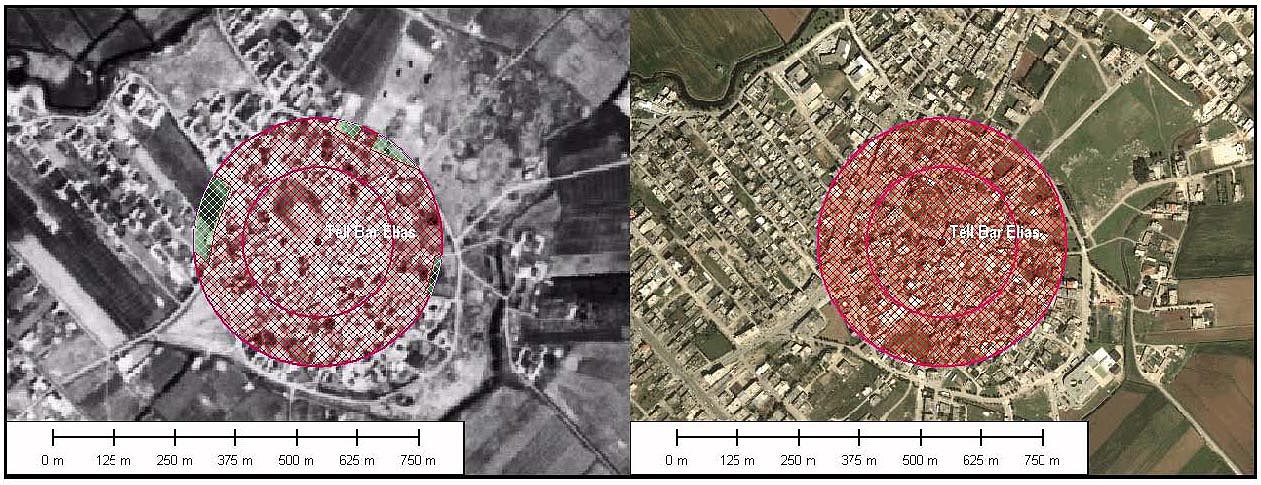
Figure 55. Tell Bar Elias in 1970 (left) and 2010 (right).
A medium-sized (7.478 ha, 12.834 ha buffer, total, 20.312 ha) tell site located south of Zahle in the southern Beqa’a Valley, Tell Bar Elias (fig. 55, A-16, B-30) has documented remains from the EB I, EB II, EB III, MB IIb/c, LB I, LB II, Iron I, and Islamic Periods. The site was already completely developed in 1970 CORONA imagery. A few small areas in the buffer were still in agriculture in 1970, but by 2010 these had also been developed. Redder pixels in the ASTER image in the site buffer indicate that the agricultural land had already begun to vanish by 2001.
Figure 56. A Google Earth image from March 21, 2010 shows an exit ramp on
a divided highway is being built less than 800 meters west of Tell Bar Elias.
These changes are not statistically significant, since most of the development had already occurred prior to 1970. However, the base of the tell is less than 800 meters east of an exit ramp of a divided highway currently being built in the Beqa'a Valley (fig. 56). The ramp will be accessed from the road that runs around the base of the site, which will attract more development to the site. The increased traffic will lead to increased commercialization along the access road. That would probably lead to larger structures being constructed on the site, which would require deeper foundations. This would result in more damage to more deeply buried archaeological remains.
Table 3: Coverage of the Analysis |
||||
|
Site Area (ha) |
Buffer Area (ha) |
Total Area (ha) |
|
Total |
316.810 |
816.022 |
1132.832 |
|
Mean |
3.864 |
9.951 |
13.815 |
|
Standard deviation |
3.002 |
2.868 |
5.773 |
|
Having examined the effects of specific types of impacts, both disturbances and threats, on numerous sites in Lebanon, we now turn to a discussion of our results as viewed across the entire dataset. Table 3 below gives the total area analyzed in for all sites and their100 meter buffer boundaries. The buffer areal calculations exclude the region defined by the site or tell. Thus the 82 sites investigated sum to 316.8 ha and when combined with buffers, the total area analyzed equals 1132.832 ha. It should also be noted here that final areal calculations for each of the above categories do not always sum precisely to the combined area of each site and its buffer. This is due to two factors, the first stemming from the nature of and precision in digitizing category boundaries. Since a visual assessment of each category is necessarily subjective, and an approximation at best, the classification polygons may not precisely follow the interior or exterior boundary of the site or buffer. Nevertheless, it is our opinion that the polygons used to calculate class area are representative of those features. This has resulted in slight deviations in total class areas from total site and buffer area. Since this deviation is only in the order of hundredths of a hectare, and given the nature of the imagery used, this has been accepted as an allowable error. The second source of error derives from rounding to the nearest 1/1000th of a hectare, and is insignificant for the current scale of analysis.
Segregating each of the four classes of analysis and tabulating site and buffer areas against both the 1970 and 2010 imagery sets allows a focused overview of categorical change over time for each site (see Appendix A).
Table 4: Change in Unaltered Land Class |
|||
|
Site (ha) |
Buffer (ha) |
Total (ha) |
1970 |
90.652 |
47.220 |
137.872 |
2010 |
59.018 |
33.828 |
92.846 |
Change |
-31.634 |
-13.392 |
-45.026 |
Unaltered land (table 4) generally falls into two subcategories: The first refers to site conditions and is noted where the site surface has apparently not been affected by means other than natural processes such as wind and water erosion, and pedestrian traffic. While portions of the vegetation class could conceivably fall within this definition, it is only those regions where the surface of the site or buffer is visible that are included here. The second subcategory is generally found within buffers and includes only natural landforms. On several coastal sites, the buffer encompasses a portion of the Mediterranean Sea to the west. These few regions are included here because construction of water breaks, docks, ports, and jetties would constitute development in the above sense and do appear within the current timeframe in certain coastal areas.
Predictably, unaltered or preserved archaeological areas on sites decrease by almost half while unaltered buffer areas see a modest decrease of only around 13 ha. The former can reasonably be explained by the drastic increase in housing atop the affected sites, or where, in the rare case of resource mining, parts of the tell itself have been destroyed. In the case of buffer areas, unaltered land was most commonly represented by land that has been unusable for both agriculture and housing. This includes natural hill ranges that are too steep for development, are inaccessible, or whose sediments may be unsuitable for growing crops or orchards. This is typical of sites that lie either at the base or on top of a natural hill or other steep rise (e.g. Tell Hoch Rafqa and Tell Jdita, A-29 and A-30). In total, we find almost half of unaltered or preserved site and buffer area in 1970 being transformed into other use classes by 2010. This loss, combined with the large leap in development on and off sites, provides the most significant temporal change in the archaeological sites under study. The implications of this change will be discussed at length below.
Table 5: Change in Vegetation Land Class |
|||
|
Site (ha) |
Buffer (ha) |
Total (ha) |
1970 |
11.792 |
22.899 |
34.691 |
2010 |
7.527 |
8.917 |
16.444 |
Change |
-4.265 |
-13.982 |
-18.247 |
Vegetation (table 5) as a class was limited to primarily tree growth on site and within buffers where it could be determined that tree clusters were not part of an orchard (which would be classed as agriculture). The task of determining whether indications of groups of trees should be considered naturally occurring or were part of a long-term horticultural endeavor near a modern settlement could be problematic. In addition, there is no simple way to determine whether the presence of groups of trees amidst housing development (e.g. Tell Kabb Elias, B-60), should also be considered tangential development on a site. Since the primary means of assessing site environmental conditions is through visual examination of surface conditions, it was felt best to reserve a class for vegetation which, while potentially protecting a portion of the site, or its surroundings, may also be incorporated into development itself. Another justification for segregating large vegetal growth is its potential in assessing surrounding land activity or inactivity, or short term acidification due to water shortages (intentional or natural). In sum, vegetation in the form of tree clusters makes up a small portion of the total landscape change classes in all 82 sites. Of these clusters, there are three main types: Those that have formed along natural drainages and artificial canals (exclusively in buffer areas); those that develop at the outer base of tells and presumably receive natural runoff water; and those that have been established through human presence, but for aesthetic or shade purposes in developed areas. The latter are still considered under the vegetation class unless their density is equal to, or less than the housing development within which they lie.
Overall, there is a decrease in vegetation in both site and buffer regions from 1970 to 2010, only by several hectares on sites, but by over half in buffer regions. Explanations for this decrease may be found in a variety of factors and combinations thereof, however the primary cause appears to be accessioning land, especially buffer areas, for housing and secondarily for agriculture. Exceptions include the Tell Hizzine, where private acquisition of the site resulted in leveling the site for housing, a swimming pool, and introduced vegetation (presented in greater detail under the Development section of the discussion of the major sources of impact on the sites in our study).
Table 6: Change in Agricultural Land Class |
|||
|
Site (ha) |
Buffer (ha) |
Total (ha) |
1970 |
152.319 |
661.859 |
814.178 |
2010 |
155.231 |
592.713 |
747.944 |
Change |
2.912 |
-69.146 |
-66.234 |
Land utilized for agriculture sees a modest increase on sites over the 40 year span, less than 3 hectares total. In contrast, buffer areas see a decrease in agriculturally utilized land by a more than 69 hectares (table 6). However, the change in agricultural land use is quite variable across our site sample—the mean difference for the combined sites and buffers is only -.808 ha, while the standard deviation is 2.268 ha (Appendix A: A-43). This illustrates two main trends: a tendency for agriculture to spread from buffers into site areas when little or no development was observed in 1970, and a tendency for agriculture to be replaced by development when development has already begun by 1970.
The total site area classed as Agriculture accounts for 49.1% of site use in 1970, while developed and unaltered classes make up the bulk of the remainder at 18.5% and 28.4% respectively. Buffer areas in total are overwhelmingly agricultural in 1970, with around 8.8% being housing, industry, or other structures. Unaltered land in buffers, as described above, is almost exclusively tied to hill slopes and other natural features, and not to visibly preserved portions of archaeological sites themselves. In 2010, there is a shift in buffer land use away from agriculture towards development. This was most often observed in housing expansion off the site, where the site itself was completely or almost completely developed itself (see Tell Rayak, below). There is a sharper drop in vegetation proportions in 2010, which is potentially explained by increasing development. Unaltered land also decreases (from 6.5% to 5.1%) but not as drastically as that on the sites themselves. This is likely due to factors related to inaccessibility, unsuitability for cultivation, etc.
Table 7: Change in Development Land Class |
|||
|
Site (ha) |
Buffer (ha) |
Total (ha) |
1970 |
56.542 |
74.788 |
131.330 |
2010 |
109.614 |
159.566 |
269.180 |
Change |
53.072 |
84.778 |
137.850 |
Developed land in total site and buffer space more than doubled, from 11% in 1970 to 22.9% in 2010 (table 7). It was observed, insofar as possible with both imagery sets, that domestic housing accounted for the vast majority of this class of development, with the remaining four elements above making up the minority of site development elements. In only two confirmed cases was it possible to account for site destruction by resource mining (Tell Fadous-Kfarabida [Genz pers. comm.] and Tell Ain Sofar).
Table 8 below highlights the total number of sites and buffers under development in 1970 and 2010. Compared to 1970, there is a marked increase in the number of sites and buffers with at least partial development in 2010. Roughly, this amounts to almost half of all previously unaltered sites undergoing development in the 40 year interim.
Sites completely covered by development more than double from 6 to 14 within this period, while buffers see a modest increase of only 3 sites. As discussed above, this is presumably due to preferential use of arable land surrounding tells for agricultural purposes rather than housing, etc. It should also be noted that none of the 82 sites and buffers combined are 100% developed from 1970 through 2010. By 2010 3 sites and their buffers are completely developed: Tell Kabb Elias (10.2 ha.), Tell Bar Elias (20.3 ha.), and Tell Ghazze (13.8 ha.) (Appendix B). These three sites fall well above the mean for site sizes, and noting the prominence of the first two sites in Copeland and Wescombe (1966:61 & 69), their long term occupation comes as no surprise. It is also worth noting that they indicate a cemetery on Tell Bar Elias (1966:61). Cemeteries or other installations of ritual significance may be expected to retain cultural importance that may override otherwise optimal space for habitation or agricultural use. This is not only the case regarding modern settings of this sort, but has been demonstrated to apply over the course of centuries, if not millennia. In such cases, an additive process of burial space prevents, or at least slows other types of land use. Tell Ghazze’s mound is already well developed in 1970, with agriculture extending east-west in the far southern and northern parts of the buffer. Again, these narrow agricultural bands are completely subsumed by the modern village by 2010.
Table 8: Number of Sites under Development in Early and Late Imagery. |
|||
Development In |
Extent |
# Sites in 1970 |
# Sites in 2010 |
Site |
None |
48 |
28 |
|
Partial |
28 |
40 |
|
Complete |
6 |
14 |
|
|||
Buffer |
None |
48 |
24 |
|
Partial |
34 |
55 |
|
Complete |
0 |
3 |
|
|||
Site and Buffer |
None |
37 |
20 |
|
Partial |
45 |
59 |
|
Complete |
0 |
3 |
Tell Ain Sofar and Tell Chtaura are the only sites with a reduction in development between the two imagery sets at roughly -0.2 ha each. The CORONA imagery shows quarrying activity at Tell Ain Sofar that apparently undergoes reclamation of about 1 ha for agriculture (possibly terracing) on the south side of the site and a portion of the buffer (See Appendix B). As there are no detailed descriptions in Copeland and Wescombe, the original state of the site is based solely on the imagery itself. Tell Chtaura appears to lose 0.2 ha of development to agriculture on the site, while increasing within the buffer by 1.1 ha on the north side.
All site and buffer areas combined illustrate the same general trend as summarized above. Distinct changes in landscape use revolve primarily around development, which is the only landscape class to increase consistently and markedly in both site and buffer regions. While agriculture increased from 49.1 to 50.5 percent on sites, the overall trend is one of decrease (from 73.1 to 66.9 percent for all areas combined). Unaltered land, including visibly preserved site areas, decreases from 12.1 to 8.4 percent overall.
The combined site and buffer land classifications are correlated when viewed as changes in percentages from 1970 to 2010. The correlations reveal underlying trends in shifting land use over time. Since the study is based on complete classification into one of four categories in bounded regions (the site and buffer), classification is necessarily a zero-sum operation. When a class increases over time, at least one of the other three classes must decrease, providing a series of mostly negative correlations (table 9), using Pearson’s r.
Table 9. Correlation Coefficients (Pearson's r) on Total Percent Change |
|||
|
Vegetation |
Agriculture |
Development |
Unaltered |
-0.099 |
-0.162 |
-0.204 |
Vegetation |
|
-0.345 |
0.174 |
Agriculture |
|
|
-0.878 |
Of all the correlation values observed, only that between Vegetation and Development is very weakly positive; this illustrates a small tendency for vegetation to be introduced along with mostly residential construction, as landscaping features such as specimen trees, grape arbors and the like. The relationship as seen here is quite weak, since we did not digitize every visible tree in a residential development. Thus, the relationship may be somewhat stronger than our study depicts it.
A negligible relationship is indicated between the unaltered and vegetation classes. In general, unaltered land decreases over time (Table 3), and so does vegetation (Table 4). Only Tell Jdita shows much of an increase in vegetation (from 7 to 15.1 percent) between 1970 and 2010, confined mostly to the slopes of the site in areas that were previously classed as unaltered.
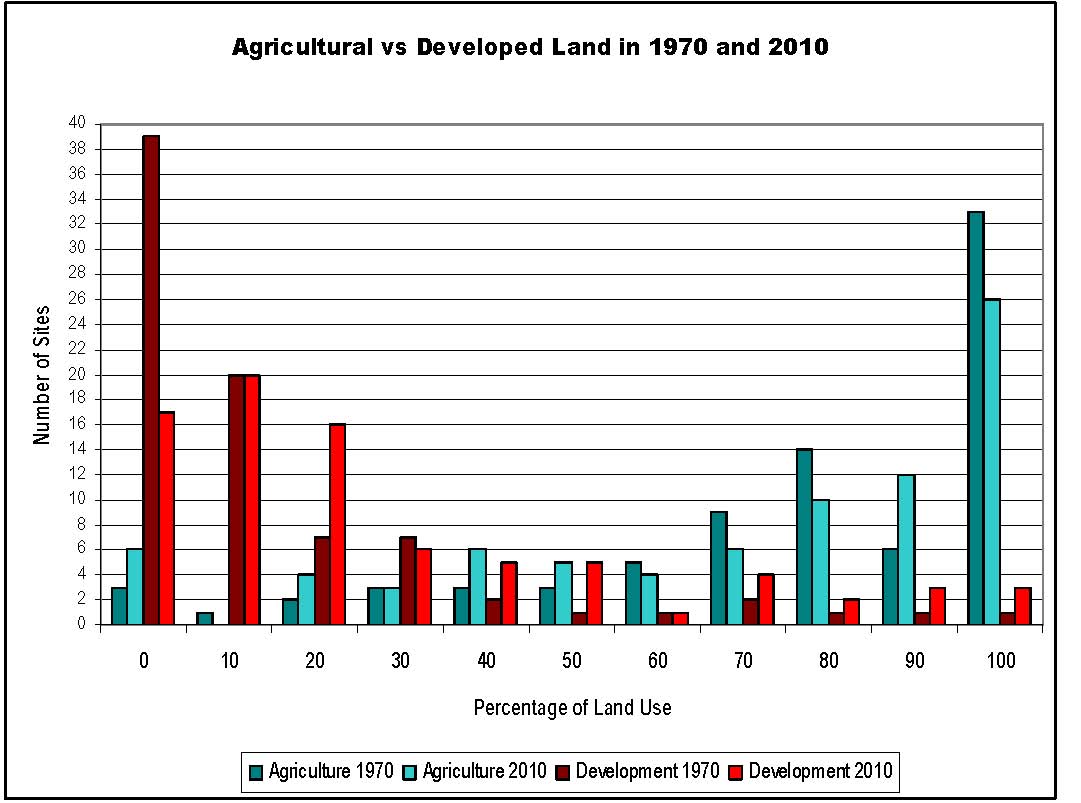
Figure 57. Agricultural vs. developed land in 1970 and 2010.
A moderately negative relationship exists between changes in agriculture and vegetation. Generally, when vegetation increases, it does so by encroaching on previously agricultural land, or in tandem with development. While this happens to a small degree with a number of sites, a comparison of the z-scores for change in total percent of vegetation and total percent of agriculture (Appendix A) demonstrates that it is nowhere statistically significant. For example, at Tell Meouchi, the z-score for change in percent of agricultural land in the site and buffer combined is -4.582 (p < 0.00001), yet the z-score for change in percent of vegetated land in the site and buffer combined is only .35 (p = 0.3632), so the decrease in agriculture at Tell Meouchi does not contribute significantly to the slight increase in vegetated land.
Conversely, the moderately negative relationship between vegetation and agriculture indicates that when farmland expands, it does so to some small extent by clearing previously vegetated areas of sites and buffers. Tell Frach (A-26, B-50) is an example--much of the southern buffer was classed as vegetation in 1970, but by 2010 it was all agricultural. These changes are statistically significant. The z-scores for total percent change in agriculture and total percent change in vegetation are 2.8 (p = 0.0026) and -3.664 (p = 0.0001) respectively.
There is a very strong negative relationship between agricultural land and developed land in the sites and buffers of the dataset (table 9, fig. 57). When development increases on a site and its buffer, it is almost always at the expense of agricultural land. Using the aforementioned Tell Meouchi again, the z-score for the change in the developed land class in the site and buffer combined was 4.342 (p < 0.00001). Thus, Tell Meouchi (A-35, B-68) is an extreme example of replacement of agricultural land with development. Other sites where this relationship is statistically quite significant include Tell Neba'a Faour I (A-36, B-70), Tell Ma'shuq (A-34, B-66), and Tell Serhan (A-40, B-78). The statistically significant relationships always represent a decline in agriculture and a corresponding increase in development. As mentioned earlier, there are only two cases where there was an observed decrease in development and a corresponding increase in agriculture, Tell Ain Sofar (A-11, B-21) and Tell Burak (A-17, B-33).
This study has significantly enhanced current methods of archaeological site prospecting through the development and refinement of techniques that make use of Landsat TM, ASTER, Google Earth, and CORONA imagery. The innovative use of ImageJ software, an open-source program developed for analysis of medical tissue thin sections, to archaeological site prospecting is especially exciting. The method, developed by Rempel, is innovative and cost-effective, and can be applied to broad regions outside our immediate study area to significantly increase our knowledge of archaeological site inventories, though it still needs some refinement to eliminate as many false positives as possible
The impacts of agriculture, warfare and the explosive development of urban areas and their supporting infrastructure have had an extremely adverse effect on archaeological resources in the Middle East. It has been especially severe in Lebanon, which has experienced a civil war and several incursions by the IDF in the forty-year period that spans the production of the satellite imagery to be used by this study. Our methods for discerning site footprints and of assessing the amount of development and that has occurred on archaeological sites have documented this damage in a quantitative manner. This information helps provide a knowledge base of “sites at risk” and thus helps to target specific preservation efforts.
Placing the newly acquired and corrected archaeological site information in the Digital Archaeological Atlas of the Holy Land has enabled it to be viewed by the public and preservation professionals on a web portal, through Google Maps and Google Earth API tools. The DAAHL database currently contains more than 18,000 archaeological sites in the Levant, and continues to expand with the incorporation of major data sets contributed by an international group of researchers from Jordan, Israel, the Palestinian Territories, Great Britain, Norway, Canada and the United States. Placing the data from Lebanon and Syria into the DAAHL database has significantly raise the profile of archaeological studies in Lebanon, and raised public awareness of the importance of site preservation in this important region of the Middle East. Specifically, this will have a significant impact on how the site data is disseminated and used. Ultimately, the data-sharing model developed for the DAAHL node in the MedArchNet will have applicability for any group interested in building cyberinfrastructures for world cultural heritage around the world in regions such as North and South America, India and China.
The ultimate archaeological results of this study, which will be developed in Rempel’s Ph.D., dissertation, are expected to revolutionize our current understanding of the development and decline of human communities at the end of the Levantine Early Bronze Age, and their resurgence in the subsequent Middle Bronze Age. EBA communities in the southern Levant favored adaptive strategies that preserved flexibility and autonomy over those that emphasized maximum productivity. They never fully relinquished the flexibility needed to adapt to economic downturns and periods of political instability, resisting full integration by maintaining a diverse subsistence base and a high degree of autonomy. South Levantine EBA people and communities established long-term social and environmentally adaptive responses that enabled them to endure repeated cycles of systemic collapse and regeneration. Their patterns of adaptation and hardiness continue to resonate in the modern Middle East (LaBianca 2009). This study will help document the similarity of these south Levantine adaptive patterns to larger regions of the Levant.
Allam, Nathalie (2011). “Farming is like Gambling”; An Examination of the Decline of Produce Farming in Lebanon’s Central Bekaa Valley. 2009 M.A. Thesis, Faculty of the Elliott School of International Affairs of the George Washington University. Ann Arbor, University Microfilms, UMI Number: 1496646.
Al Akbar English (2012). “Beirut developers destroy ancient Phoenician port.” Al Akbar English June 26, 2012. Accessed July 20, 2012, http://english.al-akhbar.com/content/beirut-developers-destroy-ancient-phoenician-port.
Ammerman, A. (1985). “Plow-Zone Experiments in Calabria, Italy” Journal of Field Archaeology 12:33-40.
Anonymous (1986). “The War of the Camps.” Journal of Palestine Studies, Vol. 16, No. 1 (Autumn, 1986), pp. 191-194.
Asada, N., N. Hirata, H. Demura, N. Harada, Y. Shibata, S. Kikuchi, T. Hodukuma, J. Haruyama, M. Ohtake, Y. Yokita, T. Morota, C. Honda, T. Matsunaga, Y. Ogawa, M. Torii, T. Nimura, H. Araki and S. Tazawa (2008). "Computational Geology for Lunar Data Analysis from LISM on Kaguya." In Advances in Geosciences Volume 19: Planetary Science (PS), pp. 77-88. Edited by A. Bhardwaj. Singapore: World Scientific Publishing.
ASU Mars Space Flight Facility (2012). "JMARS Crater Counting Layer." Java Mission-planning and Analysis for Remote Sensing (JMARS). Accessed August 6, 2012, http://jmars.asu.edu/crater-counting-layer
Baranski, D. (1964). “Second preliminary report on the Excavations at Tell al Ghassil.” Bulletin Du Musee De Beyrouth, Tome XVII, Beirut.
Barkami, D. (1961). “Preliminary report on the excavations at Tell el Ghassil.” Bulletin Du Musee De Beyrouth, Tome XVI, Beirut.
Barkami, D. (1966). “Third preliminary report of the excavations at Tell el Ghassil.” Bulletin Du Musee De Beyrouth, Tome XIX, Beirut.
BBC NEWS (2007). "Fresh clashes engulf Lebanon camp." BBC News, 06/01/2007. Accessed July 9, 2012, http://news.bbc.co.uk/go/pr/fr/-/2/hi/middle_east/6710667.stm.
Blue Shield and IMCuRWG (2011). Mission Report: Civil-Military Assessment Mission for Libyan Heritage, September 28 to 30, 2011. Association of National Committees of the Blue Shield (ANCBS) and International Military Cultural Resources Work Group (IMCuRWG). Accessed July 9, 2012, https://www.temehu.com/imazighen/berberdownloads/blueshield-mission-report-libya-2011.pdf.
Bogdanos, Matthew (2005). Thieves of Baghdad. New York: Bloomsbury.
Bogdanos, Matthew (2012). “Opinion: Illegal antiquities trade funds terrorism.” CNN World, July 07, 2011. Accessed July 20, 2012, http://articles.cnn.com/2011-07-07/world/iraq.looting.bogdanos_1_antiquities-trade-iraq-s-national-museum-looting?_s=PM:WORLD
Bonatz, D. (2001). Mountains and Plains: Archaeological Survey in the Hinterland of Kamid al-Loz / Lebanon. Report on the First Campaign. Orientalisches Seminar - Vorderasiatische Archäologie.
Cattan, Henry (1988). The Palestine Question. New York: Croom Helm.
CENTCOM Historical/Cultural Advisory Group (2012). "The Impact of War on Iraq's Cultural heritage: Operation Iraqi Freedom." Accessed July 9, 2012, http://www.cemml.colostate.edu/cultural/09476/chp04-12iraqenl.html.
Cochrane, Paul (2003). “Archaeology in Lebanon goes begging.” The Daily Star, July 31, 2003. Accessed July 19, 2012, http://www.lebanonwire.com/0307/03073110DS.asp.
Cohen, Rudolph (1980). The Marvelous Mosaics of Kissufim. Biblical Archaeology Review 6:01 Jan-Feb 1980.
Copeland, L. and P. J. Wescombe (1966). Inventory of Stone-Age Sites in Lebanon (Part Two: North, South, and East-Central Lebanon). Melanges De L'Universite Saint-Joseph XLII. Beirut : Imprimerie Catholique.
Deeb, Marius (2004). Syria's Terrorist War on Lebanon and the Peace Process. New York: Palgrave MacMillan.
Dever, W. G. (1989). "The Collapse of the Urban Early Bronze Age in Palestine - Toward a Systemic Analysis," in L'urbanisation de la Palestine a l'age du Bronze Ancien, vol. 527. Edited by P. de Miroschedji, pp. 225 - 246. Oxford: BAR International Series.
Dickson, Antony, Guy Hopkinson & Steve Timms (2005). "The Effects of Agricultural Practices on Archaeological Remains." Accessed July 12, 2012, http://www.archaeologicalplanningconsultancy.co.uk/thornborough/search_deliver.php?Unique_ID=31&Page=1/1.
Doumet-Serhal, Claude (1996). Les fouilles de Tell El-Ghassil de 1972 à 1974: étude du matérial. Beirut: Institut français d'archéologie du Proche-Orient .
Falconer, S. E. and S. H. Savage (1995). Heartlands and hinterlands: alternative trajectories of early urbanization in Mesopotamia and the southern Levant. American Antiquity 60(1):37-58.
Fisk, Robert (1991). “The Biggest Supermarket in Lebanon: A Journalist Investigates the Plundering of Lebanon's Heritage.” Berytus Vol. XXXIX. Accessed August 2, 2012, http://almashriq.hiof.no/ddc//projects/archaeology/berytus-back/berytus39/fisk/index.html.
Fisk, Robert (2002). Pity the Nation: The Abduction of Lebanon. New York: Nation Books.
Fisk, Robert (2012). “Syria's ancient treasures pulverized.” The Independent, Monday 06 August 2012. Accessed August 6, 2012, http://www.independent.co.uk/opinion/commentators/fisk/robert-fisk-syrias-ancient-treasures-pulverised-8007768.html.
Fraoua, Ridha (2012). “Legislative and institutional measures to combat trafficking in cultural property in Arab States.” Paper presented at the Second Meeting of States Parties to the 1970 Convention UNESCO Headquarters, Paris, 20 and 21 June 2012.
Gazda, Elaine K., editor (1983). Karanis: An Egyptian Town in Roman Times. Discoveries of the University of Michigan Expedition to Egypt (1924-1935). Ann Arbor: Kelsey Museum of Archaeology.
Gibson, McGuire (1997). "The loss of archaeological context and the illegal trade in Mesopotamian antiquities. Culture Without Context, Issue 1, Autumn 1997. Illicit Antiquities Research Centre. Accessed July 9, 2012, http://www.mcdonald.cam.ac.uk/projects/iarc/culturewithoutcontext/issue1/gibson.htm.
Governor General of the Sudan (1905). The Antiquties Ordinance 1905. Promulgated in Sudan Gazette No 80, of 24 August 1905. In Ordinances Promulgated By The Governor General of the Sudan Together with Selected Proclamations Notices Rules and Orders Issued with Reference Thereto in the Years 1899 to 1905. Cairo: Al Mokattam Printing Office.
Grant, Rebecca (2002). “The Bekka Valley War.” Air Force-Magazene.com: Online Journal of the Air Force Association 85(6). Accessed July 17, 2012, http://www.airforce-magazine.com/MagazineArchive/Pages/2002/June%202002/0602bekaa.aspx.
Hapgood, David and David Richardson (1984). Monte Cassino. New York: Congdon & Weed.
Harrison, Timothy, Brian Hesse, Stephen Savage, and Douglas Schnurrenberger (2001). Urban Life in the Highlands of Central Jordan: A Preliminary Report of the 1996 Tall Madaba Excavations. Annual of the Department of Antiquities of Jordan, XLIV: 211-229.
Heinz, M. (2004). Kamid el-Loz in the Bequa'a plain / Lebanon: Excavations in 2011, 2002 and 2004. Bulletin d'archéologie et d'architecture libanaises 8:83-117.
Heinz, M. (2010). Kamid el-Loz : intermediary between cultures; more than 10 years of archaeological research in Kamid el-Loz (1997 to 2007). Beyrouth: Ministère de la Culture, Direction Générale des Antiquités.
Ibanez, Juan J., Maya Haïdar-Boustani, Angel Armendariz, Rita Balech, Maryam Bshesh, Jesus Gonzalez-Urquijo, Abderrahman Kosa, Salah Shaker, and Luis Teira (2004). Mission Conjointe Siro-Libano-Espagnole De Prospections et Sondages Archeologiques a L'Ouest de la Ville De Homs: Campagne 2008 Report Scientifique. Instituto de Prehistoria, Universidad de Cantabria.
ICOMOS/ICAHM (2002). "ICOMOS World Report 2001-2002 on monuments and sites in danger: Archaeological sites" International Council on Monuments and Sites (ICOMOS) International Committee for Archaeological Heritage Management (ICAHM). Accessed July 18, 2012, http://www.international.icomos.org/risk/2001/icahm2001.htm.
Issar, A. and M. Zohar (2004). Climate Change – Environment and Civilization in the Middle East. Berlin, Heidelberg: Springer-Verlag.
Kamlah, J. and Sader, H. (2003). The Tell el-Burak Archaeological Project Preliminary Report on the 2002 and 2003 Seasons, Baal 7: 145-173.
Karam, Naji (2012). "Beirut’s Antiquities: The Massacre Continues." Al Akbar English, April 30, 2012. Accessed July 20, 2012, http://english.al-akhbar.com/content/beirut%E2%80%99s-antiquities-massacre-continues.
LaBianca, Ø. S. (1990). Sedentarization and Nomadization: Food System Cycles at Hesban and Vicinity in Transjordan. Hesban 1. Berrien Springs, MI: Andrews University Press.
LaBianca, Ø. S. (2009). Tall Hisban, Jordan: Window on the March of Empires and the Hardy People that Outlasted Them. In Global Moments in the Levant, pp. 52-59, edited by L. Manger and Ø. S. LaBianca. Bergen: Unifob Global, University of Bergen.
Lambeth, Benjamin S. (2011). Air Operations in Israel’s War Against Hezbollah: Learning from Lebanon and Getting It Right in Gaza. Santa Monica: RAND Corporation.
Lehmann, Gunnar (2002). Bibliographie der archäologischen Fundstellen und Surveys in Syrien und Libanon. Orient-Archaeologie. Deutsches Archaeologisches Institut, Orient-Abteilung, Leidorf (Rahden/Westfalia).
Levy, T., S. Savage and Ø. S. LaBianca (2009). Digital Archaeological Atlas of the Holy Land. In Global Moments in the Levant, pp. 242-255, edited by L. Manger and Ø. S. LaBianca. Bergen: Unifob Global, University of Bergen.
Marfoe, Leon (1978). Between Qadesh and Kumidi: A History of Frontier Settlement and Land Use in the Biqa', Lebanon. Ph.D., University of Chicago.
Menze, B. H., J. A. Ur, and A. G. Sherratt. (2006). Detection of Ancient Settlement Mounds: Archaeological Survey Based on the SRTM Terrain Model. Photogrammetric Engineering & Remote Sensing 72:321-327.
Moussaoui, Rana (2010). “Lebanon's archaeological sites a pillager's paradise.” The Telegraph, March 25, 2010. Accessed July 19, 2012, http://www.telegraph.co.uk/expat/expatnews/7519622/Lebanons-archaeological-sites-a-pillagers-paradise.html.
Matsumoto, Ken and Hisahiko Wada (2001). Report on the Archaeological Survey in the Hilly Area of Akkar Region in North Lebanon. Al-Rafidan (Journal of Western Asiatic Studies) 22(2001):93-111.
Najem, T. P. (2000). Palestinian-Israeli Conflict and South Lebanon. Economic and Political Weekly 35(46): 4006-4009. Stable URL: http://www.jstor.org/stable/4409949.
Nesmenser, Berber (2011). "Archaeological Plunder, Robbery & Vandalism." 11/23/2011. Accessed July 9, 2012, http://www.temehu.com/Cities_sites/museumvandalism-archaeological-robberies.htm.
O'Connor, Sean (2012). “Soviet/Russian SAM Site Configuration,Part 2: S-300P/S-400 / SA-10/20/21, S-300V/SA-12, 2K11/SA-4, 2K12/SA-6, 9K37/317/SA-11/17. Technical Report APA-TR-2009-1205-B.” Accessed July 10, 2012, http://www.ausairpower.net/APA-Rus-SAM-Site-Configs-B.html#mozTocId638535.
Palumbo, G. (1991). The Early Bronze Age IV in the southern Levant : settlement patterns, economy, and material culture of a 'dark age'. Università degli studi Roma "La Sapienza", Roma.
Palumbo, G. (1994). The Jordan Antiquities Database and Information System. Amman: Department of Antiquities of Jordan and the American Center for Oriental Research.
Parker, Mathew (2003). Monte Cassino: The Story of the Hardest Fought Battle of World War Two. London: Hodder Headline.
Philip, G. (2007), 'Unscrambling the 'uplands': pre-classical activity in the basalt landscape of Orontes Valley', ArchAtlas, January 2008, Edition 3, http://www.archatlas.org/workshop/Philip07.php, Accessed: 02 April 2009.
Qassem, Qassem (2012). "Palestinians in Lebanon Struggling for Neutrality." Al Akhbar English, June 20, 2012. Accessed August 2, 2012, http://english.al-akhbar.com/node/8702.
Radyuhin, Vladimir (2011). "Libyan cultural heritage in danger of going the Iraqi way." The Hindu, August 20, 2011. Accessed July 9, 2012, http://www.thehindu.com/opinion/op-ed/article2409474.ece.
Rasband, W.S. (2011). ImageJ, U. S. National Institutes of Health, Bethesda, Maryland, USA, http://imagej.nih.gov/ij/, 1997-2011.
Rempel, Sidney G. (2008). Remotely-sensed Data and Image Analysis Software as Tools for Site Relocation and Quantification in the Near East. Paper presented at the Cyberinfrastructure for the Mediterranean Archaeology Network Workshop, November 16-19 2008, UCSD, San Diego.
Rempel, S. and M. Soto-Berelov (2007). “Tell identification in the northern Jordan Valley: comparing methods using multiple remotely-sensed data sets.” Paper presented at the 72nd Annual Meeting of the Society for American Archaeology, Austin, Texas, April 25-29, 2007.
Richardson, B. F. and C. Hritz (2007). Remote Sensing and GIS Use in the Archaeological Analysis of the Central Mesopotamian Plain. In Remote Sensing in Archaeology, pp. 283-325. James Wiseman and Farouk El-Baz, editors. Interdisciplinary Contributions to Archaeology. Springer: New York.
Robinson, Edward (1856). Later Biblical Researches Palestine and in the Adjacent Regions A Journal of Travels in the Year 1852 by E. Robinson, E. Smith and Others. Boston: Crocker and Brewster.
Rosen, Arlene M. (1986). Cities of Clay: The Geoarchaeology of Tells. Chicago: University of Chicago Press.
Sader, Helen (2012). Tell el-Burak excavation project (Lebanon)." Accessed July 23, 2012, http://www.aub.edu.lb/fas/histarc/Documents/Burakproject.pdf .
Savage, Stephen H. (2010). Jordan's Stonehenge: The Endangered Chalcolithic/Early Bronze Age Site at Al-Murayghât - Hajr al-Mansûb. Near Eastern Archaeology 73(1): 32-46.
Savage, S. H. (2007). “Controlling Space at the Regional Level: Geographic Information Systems (GIS) and JADIS in Jordan” In Crossing Jordan: North American Contributions to the Archaeology of Jordan, pp. 37-46, edited by T. Levy, M. Daviau, R. Younker, and M. Shaer. London: Equinox Publishing Ltd.
Savage, Stephen H. and Gary O. Rollefson (2001). The Moab Archaeological Resource Survey: Some Results from the 2000 Field Season. Annual of the Department of Antiquities of Jordan, XLV: 217-236.
Shadid, Anthony (2012). House of Stone: A memoir of Home, Family, and a Lost Middle East. Boston: Houghlin Fifflin Harcourt.
Sherratt, Andrew (2006), 'Tellspotting', ArchAtlas, January 2008, Edition 3, http://www.archatlas.org/Tellspotting/TellsMain.php, Accessed: 02 April 2009.
Siddiq, Nazah (2007). "Lebanon army advances into camp." Reuters, U.S. edition. July 15, 2007. Accessed July 9, 2012, http://www.reuters.com/article/2007/07/15/us-lebanon-fighting-idUSL1434460820070715.
Simonich, Staci L. and Ronald A. Hites (1995). “Global Distribution of Persistent Organochlorine Compounds”. Science, Volume 269, September 29, 1995.
Stanley, J., Krom, M., Cliff, R. and J. Woodward (2003). Short Contribution: Nile Flow Failure at the End of the Old Kingdom, Egypt: Strontium Isotopic and Petrologic Evidence. Geoarchaeology: An International Journal, 18(3): 395–402.
Thalmann, Jean-Paul (2007). Settlement Patterns and Agriculture in the Akkar Plain During the Late Early and Early Middle Bronze Ages. Paper presented at the Urban and Natural Landscapes of an Ancient Syrian Capital Settlement and Environment at Tell Mishrifeh/Qatna and in Central-Western Syria, December 9-11 2004, Udine, Italy.
Thorne, Robert M., Richard W. Waldbauer and Paul Nickens (1997). “Archaeological Site Revegetation, Organochloride Based Pesticides, PCB’s and Their Relationships to Resource Preservation and Protection.” Natchitoches : National Center for Preservation Technology and Training United States Department of the Interior National Park Service.
Traboulsi, Fawwaz (2007). A History of Modern Lebanon. London: Pluto Press.
Trow, Stephen (2010). Farming, forestry, rural land management and archaeological historical landscapes in Europe. In Heritage Management of Farmed and Forested Landscapes in Europe (EAC Occasional Paper 4), pp. 19-25. Edited by Edited by Stephen Trow, Vincent Holyoak and Emmet Byrnes. Budapest: European Archaeological Council.
Tucker, Diane (2009). "Brutal Destruction Of Iraq's Archaeological Sites Continues." Huffington Post, September 21, 2009. Accessed July 9, 2012, http://www.huffingtonpost.com/diane-tucker/brutal-destruction-of-ira_b_290667.html.
Triposo (2012). Lebanon: Tyre. Accessed July 20, 2012, http://www.triposo.com/loc/Tyre2C_Lebanon.
UNESCO (2011). The Fight against the Illicit Trafficking of Cultural Objects -- The 1970 Convention: Past and Future. Paris: UNESCO.
UNESCO (2012). “Law N.37 regarding the Cultural Property.” Lebanon. Accessed July 19, 2012, http://whc.unesco.org/en/statesparties/lb/laws/.
UNRWA (2006a). "The Situation of Palestine Refugees in South Lebanon." August 15, 2006. United Nations Relief and Works Agency for Palestine Refugees in the Near East (UNRWA). Accessed July 9, 2012, http://unispal.un.org/UNISPAL.NSF/0/961808D098F0D27C852571CB004DB361.
UNRWA (2006b). “Situation Report: 24 hours up to 14:00 - 8 August, 2006”. United Nations Relief and Works Agency for Palestine Refugees in the Near East (UNRWA). Accessed July 9, 2012, http://www.docstoc.com/docs/67842844/UNRWA-Situation-Report---Israeli-ground-forces-pushed-deeper-into.
UNWRA (2012a). “Rashidieh refugee camp.” United Nations Relief and Works Agency for Palestine Refugees. Accessed July 10, 2012, http://www.unrwa.org/etemplate.php?id=141.
UNWRA (2012b). “Nahr el-Bared refugee camp.” United Nations Relief and Works Agency for Palestine Refugees. Accessed July 11, 2012, http://www.unrwa.org/etemplate.php?id=141.
Ur, Jason (2007), 'Agricultural and Pastoral Landscapes in the Near East: Case Studies using CORONA Satellite Photography', ArchAtlas, January 2008, Edition 3, http://www.archatlas.org/workshop/Ur07.php, Accessed: 02 April 2009.
Vinogradova,Tatiana, Michael Burl, and Eric Mjolsness (2002). Training of a Crater Detection Algorithm for Mars Crater Imagery. Aerospace Conference Proceedings 2002. IEEE.
Weigall, Arthur E. P. (1908). "A Report on Some Objects Recently Found in Sebakh and Other Diggings." Annales du Service des Antiquities de l'Égypte. 8 : 39-50. Cairo : Institut Français d'Archéologie.
Weiss, H., M. A. Courty, W. Wetterstrom, F. Guichard, L. Senior, R. Meadow, and A. Curnow. (1993). The Genesis and Collapse of Third Millennium North Mesopotamian Civilization. Science 261:995-1004.
Wilkinson, Tony J. 1982. “The definition of ancient manured zones by means of extensive sherd-sampling techniques.” Joumal of Field Archaeology 9:232-333.
| |
All Classifications |
| |
Site (ha) | |
Buffer (ha) | |
Total (ha) | ||||||||||||
| Sum | |
Mean | |
Std. | |
Sum | |
Mean | |
Std. | |
Sum | |
Mean | |
Std. | |
| |
316.810 | 3.864 | 3.002 | 816.022 | 9.951 | 2.868 | 1132.832 | 13.815 | 5.773 |
Unaltered |
||||||||||||||||||||||||||||||
| Site (ha) | Site (%) | Buffer (ha) | Buffer (%) | Total (ha) | Total (%) | |||||||||||||||||||||||||
| Sum | |
Mean | Std. | Mean | Std. | Sum | Mean | Std. | Mean | Std. | Sum | Mean | Std. | Mean | Std. | |||||||||||||||
| |
1970 | 90.652 | 1.106 | 1.987 | 28.45% | 39.40% | 47.220 | 0.576 | 1.625 | 6.48% | 20.09% | 137.872 | 1.681 | 2.972 | 12.13% | 21.54% | ||||||||||||||
| |
2010 | 59.018 | 0.720 | 1.848 | 17.59% | 31.00% | 33.828 | 0.413 | 1.214 | 5.09% | 16.88% | 92.846 | 1.132 | 2.623 | 8.45% | 18.78% | ||||||||||||||
| |
Change | -31.634 | -0.386 | 1.181 | -10.86% | 27.02% | -13.392 | -0.163 | 0.751 | -1.39% | 5.84% | -45.026 | -0.549 | 1.334 | -3.68% | 8.03% | ||||||||||||||
Vegetation |
||||||||||||||||||||||||||||||
| Site (ha) | Site (%) | Buffer (ha) | Buffer (%) | Total (ha) | Total (%) | |||||||||||||||||||||||||
| Sum | |
Mean | Std. | Mean | Std. | Sum | Mean | Std. | Mean | Std. | Sum | Mean | Std. | Mean | Std. | |||||||||||||||
| |
1970 | 11.792 | 0.144 | 0.471 | 2.71% | 7.52% | 22.899 | 0.279 | 0.675 | 2.67% | 5.65% | 34.691 | 0.423 | 0.866 | 2.75% | 4.74% | ||||||||||||||
| |
2010 | 7.527 | 0.092 | 0.460 | 1.29% | 5.60% | 8.917 | 0.109 | 0.353 | 1.17% | 3.66% | 16.444 | 0.201 | 0.563 | 1.34% | 3.38% | ||||||||||||||
| |
Change | -4.265 | -0.052 | 0.230 | -1.42% | 6.13% | -13.982 | -0.171 | 0.587 | -1.50% | 4.91% | -18.247 | -0.223 | 0.699 | -1.41% | 3.96% | ||||||||||||||
Agriculture |
||||||||||||||||||||||||||||||
| Site (ha) | Site (%) | Buffer (ha) | Buffer (%) | Total (ha) | Total (%) | |||||||||||||||||||||||||
| Sum | |
Mean | Std. | Mean | Std. | Sum | Mean | Std. | Mean | Std. | Sum | Mean | Std. | Mean | Std. | |||||||||||||||
| |
1970 | 152.319 | 1.858 | 2.393 | 49.12% | 44.86% | 661.859 | 8.071 | 3.308 | 81.23% | 27.44% | 814.178 | 9.929 | 5.150 | 73.09% | 28.06% | ||||||||||||||
| |
2010 | 155.231 | 1.893 | 2.613 | 50.46% | 51.71% | 592.713 | 7.228 | 3.756 | 72.36% | 31.79% | 747.944 | 9.121 | 5.580 | 66.85% | 31.67% | ||||||||||||||
| |
Change | 2.912 | 0.036 | 1.778 | 1.34% | 40.28% | -69.146 | -0.843 | 1.933 | -8.87% | 19.60% | -66.234 | -0.808 | 2.268 | -6.24% | 16.60% | ||||||||||||||
Development |
||||||||||||||||||||||||||||||
| Site (ha) | Site (%) | Buffer (ha) | Buffer (%) | Total (ha) | Total (%) | |||||||||||||||||||||||||
| Sum | |
Mean | Std. | Mean | Std. | Sum | Mean | Std. | Mean | Std. | Sum | Mean | Std. | Mean | Std. | |||||||||||||||
| |
1970 | 56.542 | 0.690 | 1.479 | 18.50% | 32.32% | 74.788 | 0.912 | 2.012 | 8.81% | 18.88% | 131.330 | 1.602 | 3.250 | 10.97% | 20.39% | ||||||||||||||
| |
2010 | 109.614 | 1.337 | 2.071 | 34.52% | 38.69% | 159.566 | 1.946 | 2.834 | 19.23% | 26.68% | 269.180 | 3.283 | 4.576 | 22.88% | 27.94% | ||||||||||||||
| |
Change | 53.072 | 0.647 | 1.200 | 16.02% | 26.78% | 84.778 | 1.034 | 1.575 | 10.43% | 15.92% | 137.850 | 1.681 | 2.370 | 11.91% | 16.37% | ||||||||||||||
|
Geo-Archaeological Information Applications Lab |

|
|